
AI at Work: Transforming FMCG Warehouse Performance**
**
Introduction
In the FMCG (Fast-Moving Consumer Goods) industry, warehouses form the backbone of supply chain efficiency. For companies dealing with massive product throughput — such as food staples like noodles — warehouse performance directly impacts on-time deliveries, product availability, and customer satisfaction.
Traditional supply chain analytics often focus on retrospective reporting, which can leave managers reacting instead of proactively optimizing operations. With Terno AI, warehouse managers and supply chain analysts can interact with datasets in natural language, uncovering bottlenecks, diagnosing issues, and recommending improvements in real time.
In this blog, I’ll walk through how Terno AI was applied to the Noodles Warehouse Dataset to identify factors affecting efficiency, highlight operational risks, and suggest strategies for optimization.
👉 Dataset & Prompts explored via Terno AI: Conversation Link
Dataset Overview
**Prompt:
** “Describe the attached dataset structure, including column types, missing values, and summary statistics.”

This prompt creates a formal data dictionary: it enumerates columns, marks numeric vs categorical types, and reports missing-value hotspots and basic distributions (mean, median, min/max). That foundation prevents analytic errors (e.g., treating IDs as numeric), highlights fields that need cleaning or imputation, and clarifies which metrics are reliable. For business users, this step builds trust in any subsequent recommendation — executives want to know the quality and scope of the data before acting. Practically, it determines whether additional data collection (e.g., more accurate footprint or workforce fields) is required to make confident operational decisions.
Insight: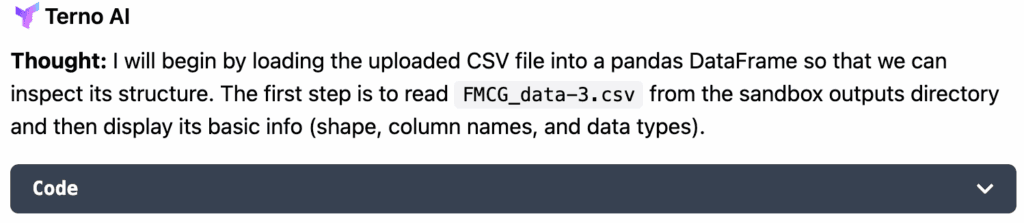
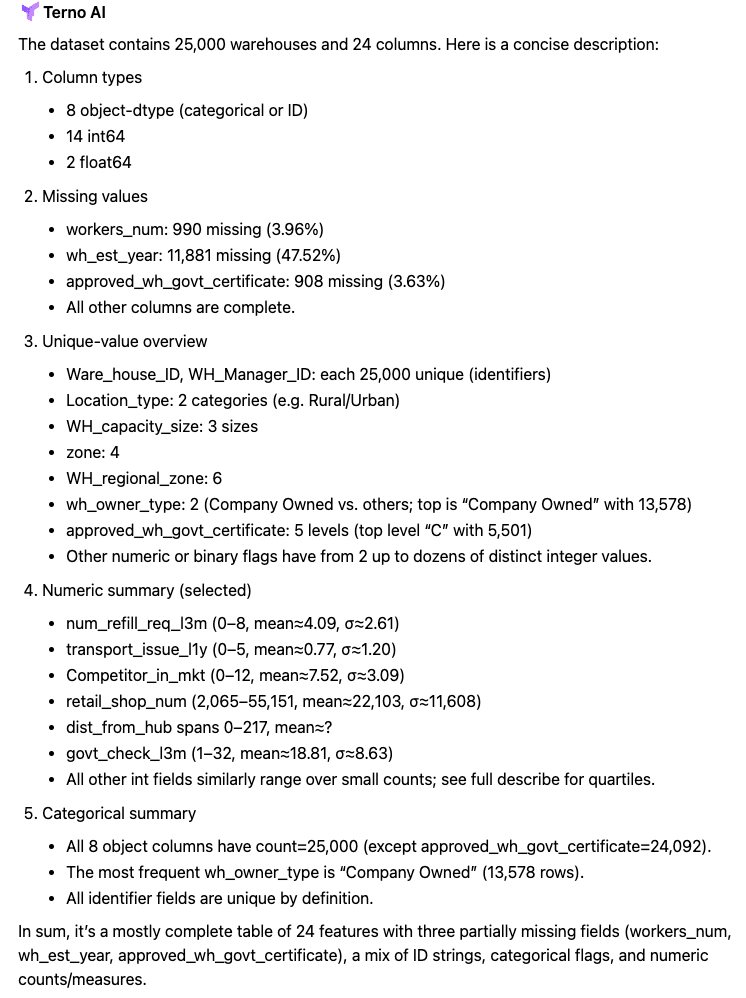
Overall, the dataset was moderately clean, with only minor missing values in infrastructure-related fields. Key predictive columns for efficiency were capacity size, refill requests, breakdowns, and flood impact.
Warehouse Size vs Throughput
**Prompt:
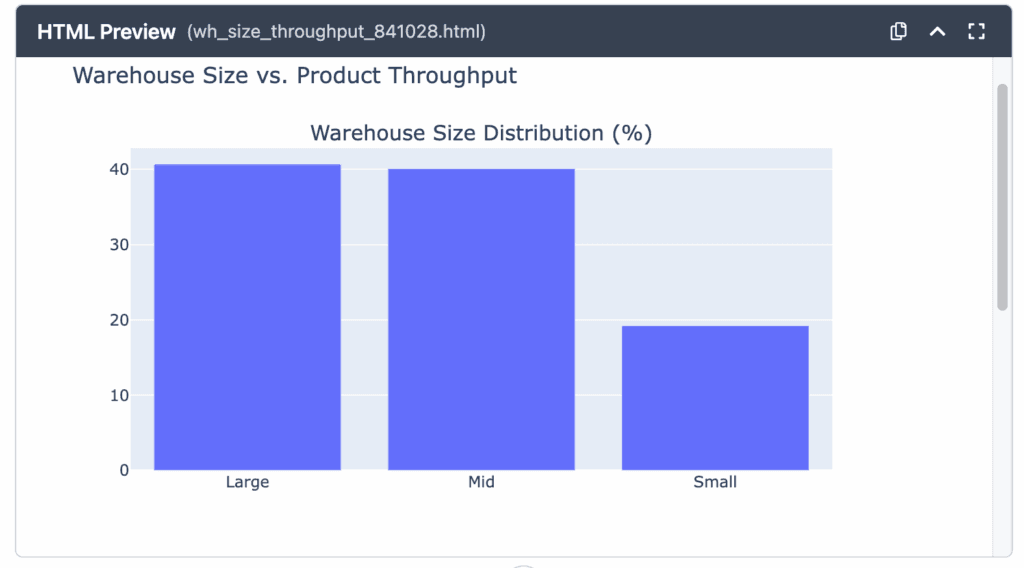
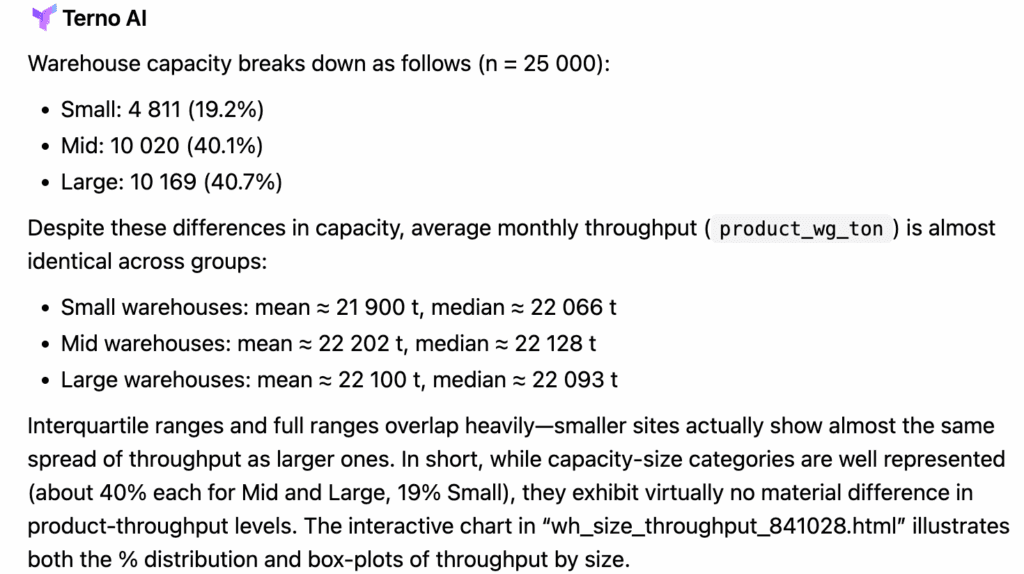
** “Explain the distribution of warehouse sizes (WH_capacity_size) and their effect on product throughput (product_wg_ton).”

Here we quantify how many warehouses fall into small/mid/large buckets and compare their throughput. That reveals whether scale drives volume linearly or if smaller sites perform more efficiently (utilization). For operations, this helps decide whether to expand capacity, consolidate SKUs into fewer large hubs, or optimize many small nodes for local service. Market decisions — like committing capex to expand a regional hub — hinge on evidence of throughput gains versus marginal costs, which this prompt supplies.
Insight: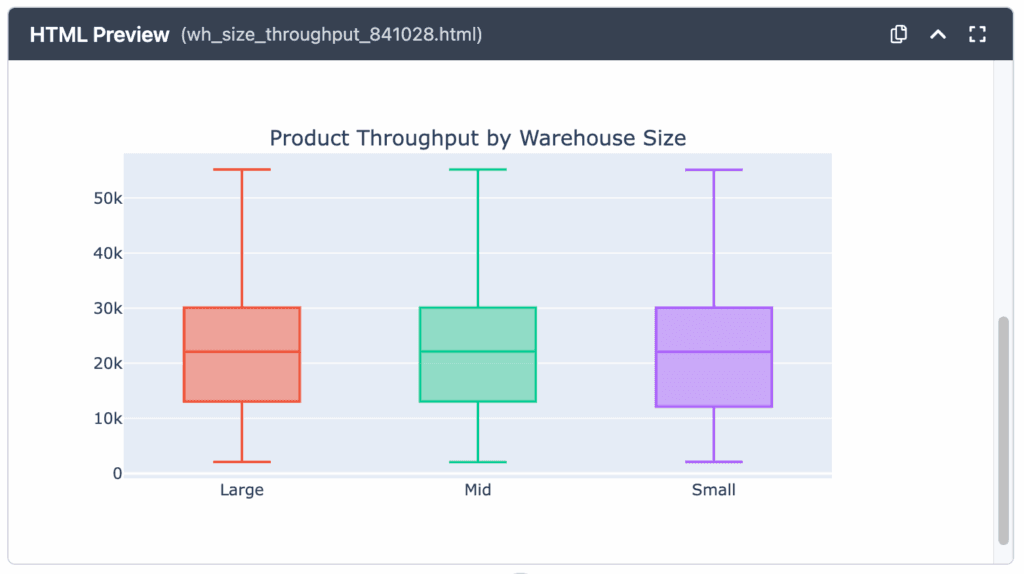
Top Warehouses by Refill Requests
**Prompt:
** “Which warehouses have the highest num_refill_req_l3m? Visualize top 10 warehouses by refill requests.”

This prompt surfaces the hotspots that most frequently need resupply, exposing demand surges, stockout risk, or poor inventory planning. A ranked chart makes it easy to see concentration (e.g., top 10 accounting for X% of requests). For operations teams, this drives tactical interventions: increase safety stock, add more frequent routes, or troubleshoot demand forecasting in those locations. From a commercial perspective, frequent refills often signal high retail velocity — candidates for premium service agreements or targeted promotions to deepen sales.
Insight: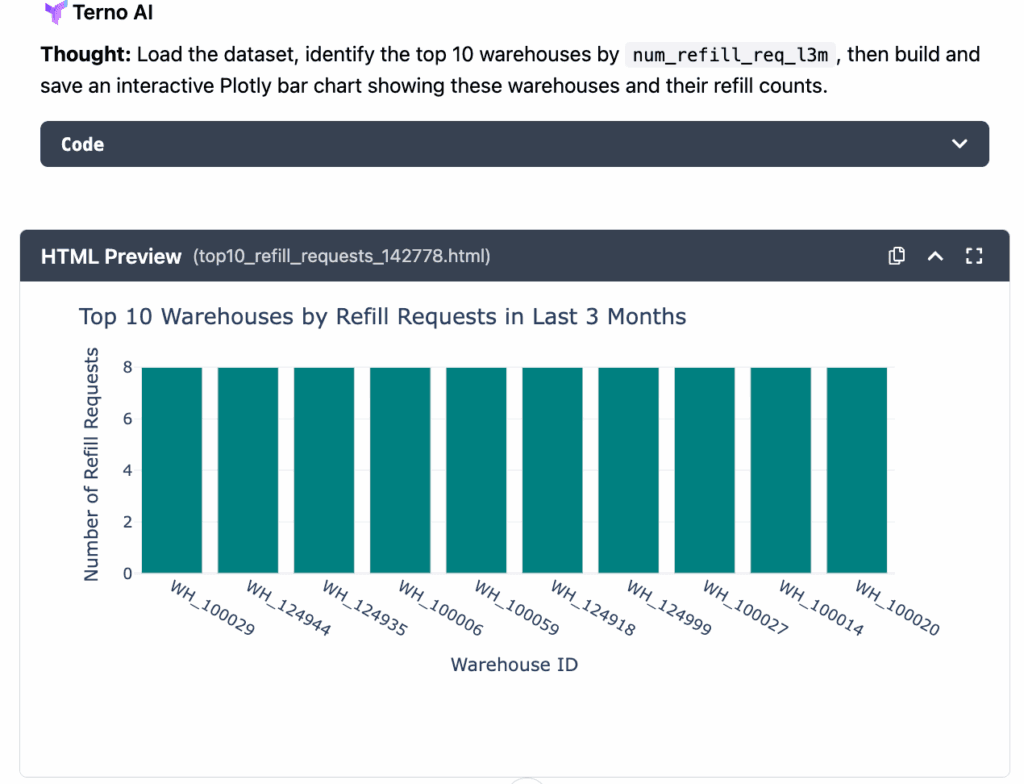
The ten warehouses with the highest number of refill requests (all 8 in the last 3 months) are:
WH_100029, WH_124944, WH_124935, WH_100006, WH_100059, WH_124918, WH_124999, WH_100027, WH_100014, WH_100020.
Transport Issues Across Zones
**Prompt:
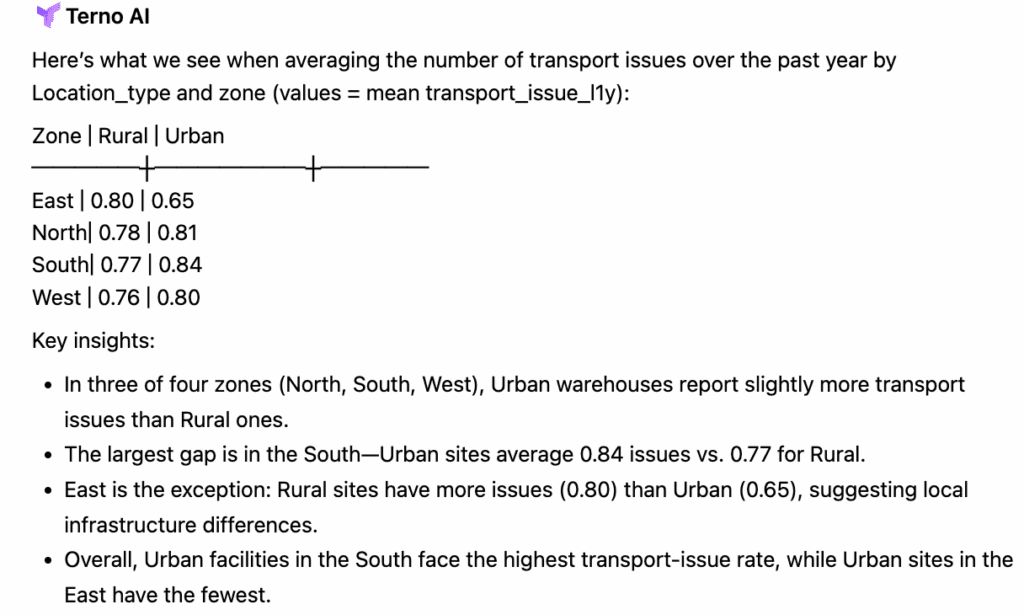
** “Analyze transport_issue_l1y distribution across Location_type and zone. Provide bar chart and insights.”

By cross-tabulating transport incidents with urban/rural location and geographic zone, this prompt identifies where logistics reliability is weakest and whether problems are localized or systemic. Visualizing counts and rates enables prioritization: are rural zones suffering poor roads, or do certain zones experience seasonal disruptions? These insights inform tactical fixes (alternate carriers, route redesign) and strategic investments (warehouse relocation, regional cross-docks). They also help quantify service risk when expanding into new retail territories.
Insight: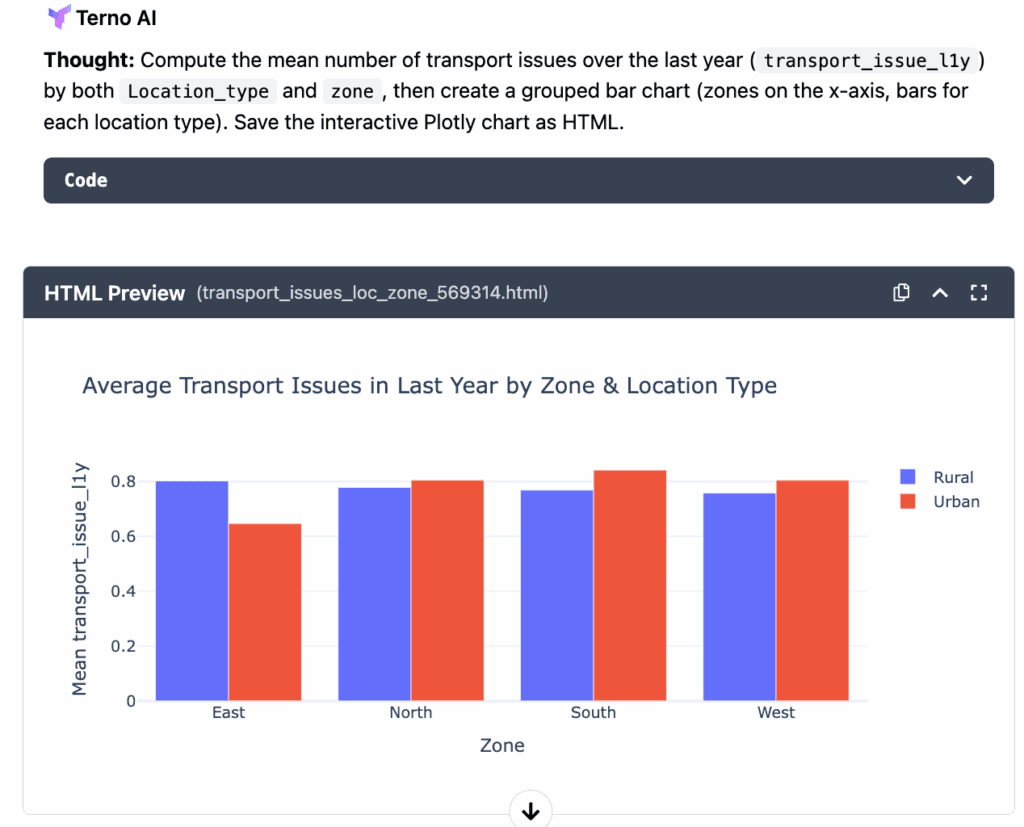
Storage & Breakdown Correlations
**Prompt:
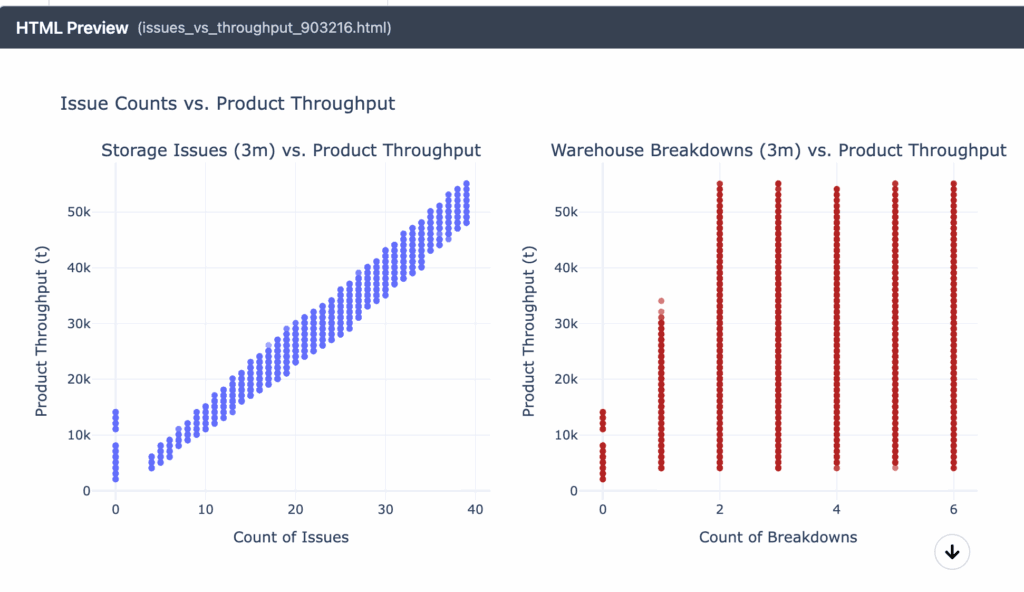
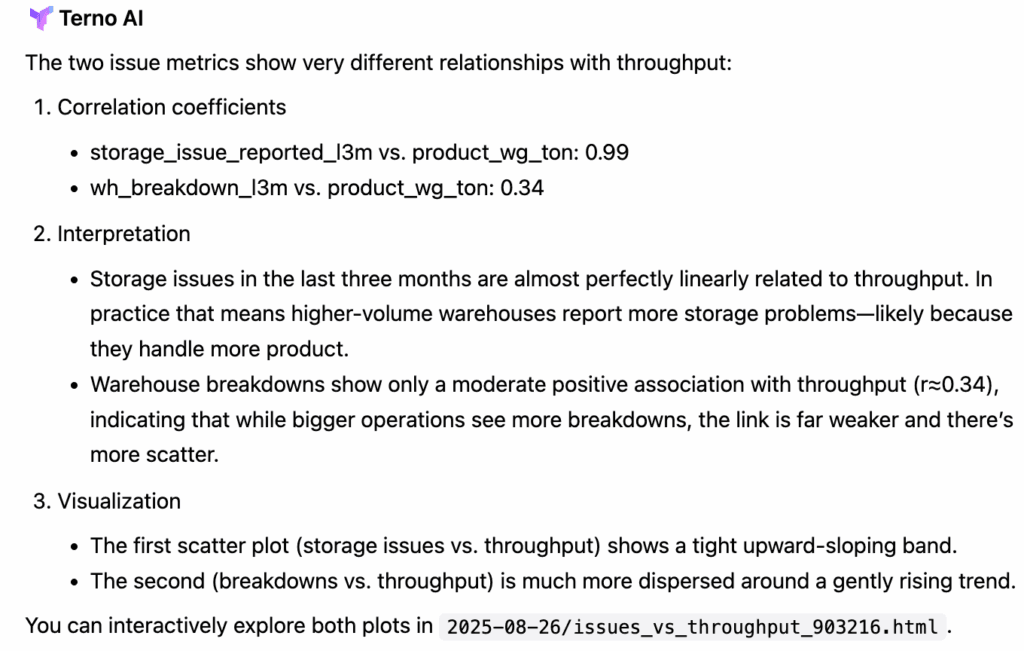
** “Examine storage_issue_reported_l3m and wh_breakdown_l3m correlations with product_wg_ton.”

This analysis measures how storage problems and equipment breakdowns correlate with throughput — whether poor storage practices or frequent breakdowns materially reduce shipped tons. Strong negative correlations point to maintenance and storage as primary bottlenecks; weak correlations suggest other drivers. For facilities managers, this justifies (or deprioritizes) spending on preventive maintenance, storage upgrades, or staff training. Finance can then calculate ROI on maintenance capex by mapping it to recovered throughput and prevented lost-sales.
Insight: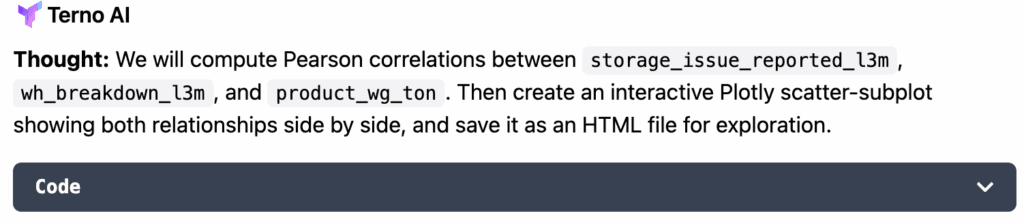
Flood Risk & Resilience
**Prompt:
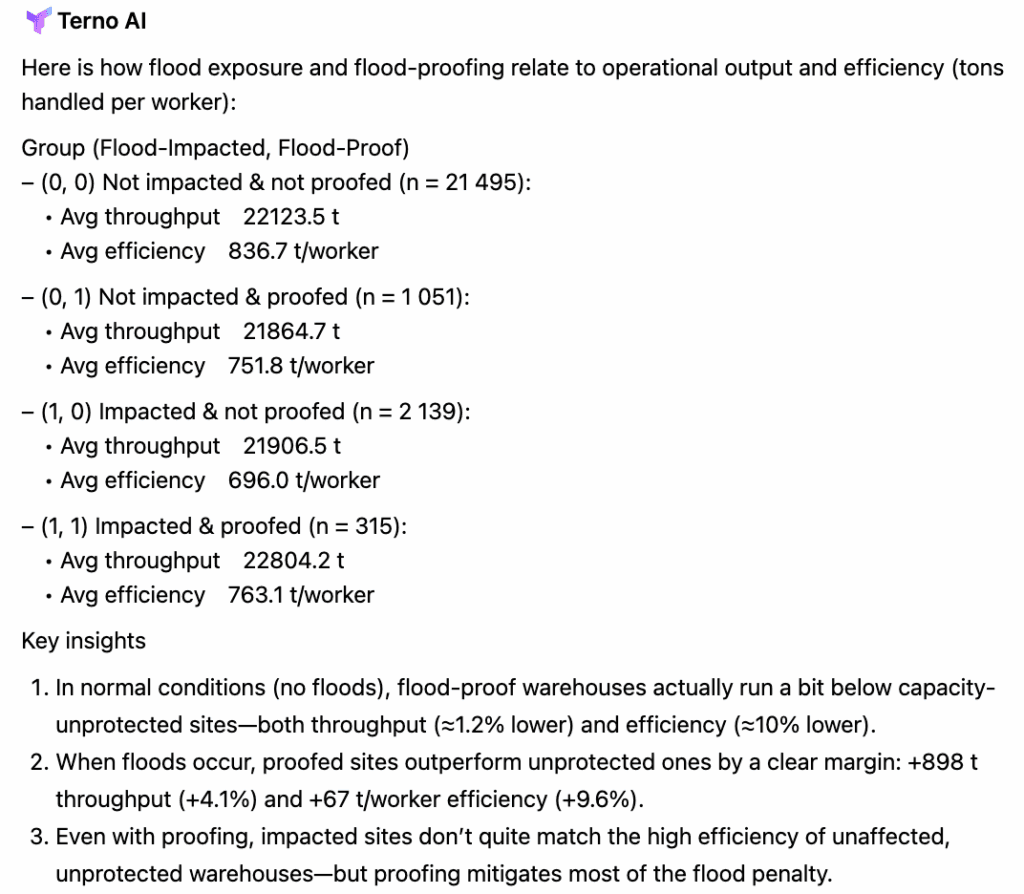
** “Analyze flood_impacted and flood_proof warehouses and their operational efficiency.”

This compares throughput between flood-impacted vs flood-proof sites to evaluate resilience value. If flood-proofed warehouses show significantly steadier throughput and fewer emergency refills, the business case for wider flood-proofing is strong. For market planning, this determines which regions need contingency stock or alternative delivery plans during monsoon seasons. Executives can use the analysis to prioritize infrastructure upgrades where weather risk threatens shelf availability and brand reputation.
Insight: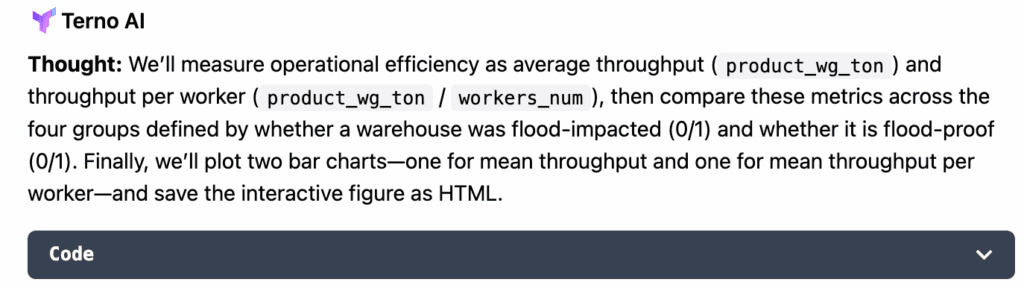
Urban vs Rural Comparison
**Prompt:
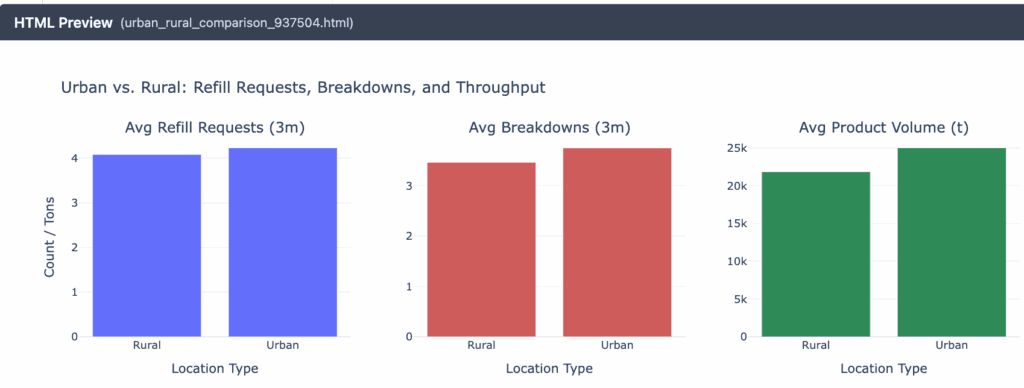
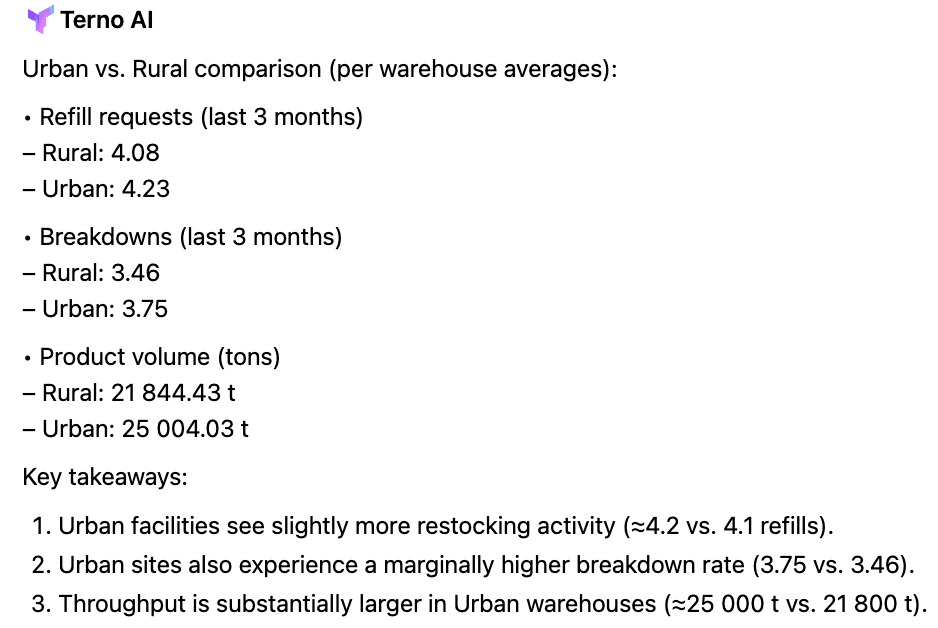
** “Compare warehouses in urban vs rural areas on metrics: refill requests, breakdowns, and product volume.”

A direct urban/rural comparison highlights structural differences: urban centers may show higher throughput and refill frequency but lower breakdown rates, while rural sites may suffer transport and maintenance issues. These different profiles require tailored playbooks: automation and higher-frequency replenishment in urban hubs versus robustness, resilient routing, and workforce upskilling in rural nodes. Market teams use this to shape pricing, promotion cadence, and service-level agreements appropriate to each context.
Insight:
Performance Trends & Bottlenecks
**Prompt:
** “Provide a detailed summary of warehouse performance trends and key bottlenecks.”

This syntheses temporal and cross-sectional findings—e.g., rising refill concentration, seasonal throughput dips, geographic clusters of transport faults—and ranks bottlenecks by impact. A clear bottleneck list (e.g., breakdowns > transport > flooding) helps leaders prioritize interventions that will unlock the most throughput. It also creates a basis for KPI targets and ownership: who fixes what and by when. Strategically, the summary becomes the decision brief used to allocate budget and manpower across operations, logistics, and resilience programs.
Insight: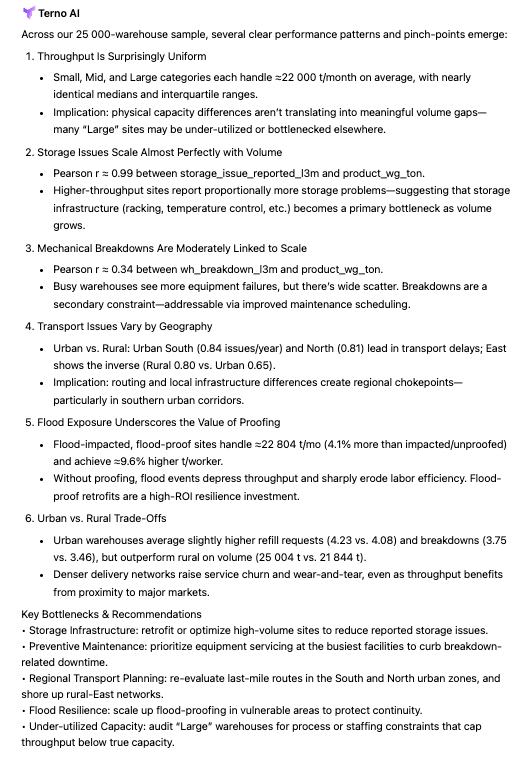
Prescriptive Recommendations
**Prompt:
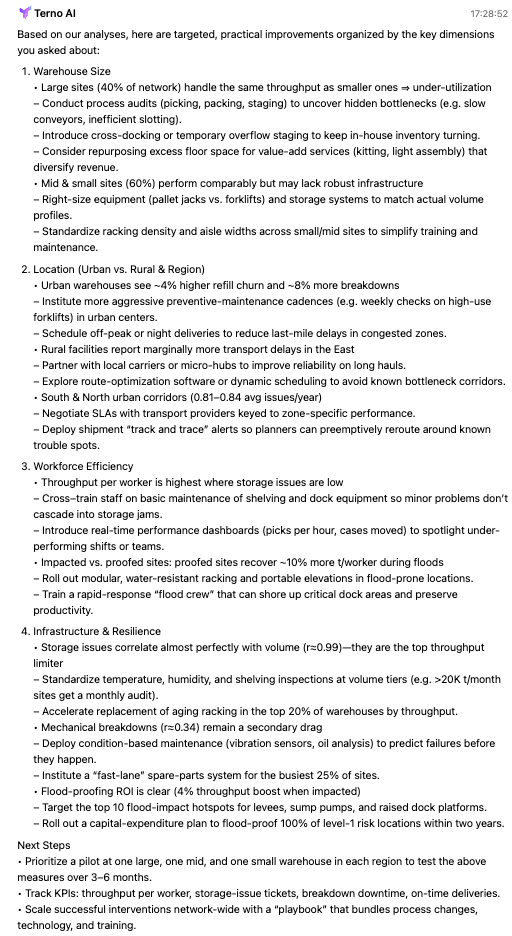
** “Recommend operational improvements based on warehouse size, location, workforce, and infrastructure.”
This prescriptive prompt converts analytics into discrete actions: optimize route frequency for high-refill small warehouses, increase preventive maintenance where breakdown correlation is strong, invest in flood-proofing for high-risk high-volume hubs, or consolidate SKUs in under-utilized large sites. Each recommendation ties to expected impact (less downtime, fewer refills, higher throughput) and implementation considerations (capex, timeline). For managers, it becomes a prioritized playbook with measurable outcomes, bridging analysis to execution and ROI tracking.
Insight:
Conclusion
Warehouse efficiency is at the heart of FMCG supply chain success. Using Terno AI, we transformed raw warehouse data into a set of actionable insights and prescriptive strategies.
From identifying refill-heavy warehouses to highlighting the impact of floods, Terno AI enabled a holistic view of performance bottlenecks and guided recommendations for maintenance, infrastructure, and resource allocation.
As FMCG companies look to scale, AI-driven decision support systems like Terno AI can provide the competitive edge to ensure warehouses remain resilient, efficient, and responsive to market demands.
👉 Explore the full interactive session here: Terno AI Link.

18 August 2026
The Honest Number Was 83%: Leakage, Abstention, and a Complaint Router You Can Actually Deploy
The same complaint-routing model scores 96.3% or 83.2% depending on which three columns you leave in the training data. The high number is the intake form being read back to you. This is what the leakage audit found before a single model was trained, why 83.2% is the honest figure, and how the same model — given permission to say "I don't know" — becomes deployable at 90.7% accuracy on 79.5% of traffic.

29 July 2026
EdgeGuard: AI-Driven Predictive Maintenance for Power Transformers
Power transformers are among the most critical assets in electrical distribution infrastructure. Their unexpected failure can result in power outages, safety hazards, equipment damage, expensive repairs, and long service interruptions. Traditional transformer maintenance practices often rely on periodic manual inspection, offline testing, or run-to-failure maintenance. These methods are expensive, slow, labor-intensive, and unable to detect rapidly developing faults in real time. EdgeGuard is an AI-driven, edge-computing predictive maintenance system designed to continuously monitor transformer health and forecast failures before catastrophic damage occurs. The system acts as a retrofittable “Digital Doctor” for distribution transformers by combining low-cost industrial sensors, an ESP32 microcontroller, local intelligence, machine learning-based risk prediction, autonomous relay control, and a real-time web dashboard. The proposed system monitors six major transformer health indicators: temperature, humidity, vibration, oil level, current, and voltage. These signals are normalized and processed through a Multi-Layer Perceptron neural network to classify transformer condition and estimate failure risk. If the predicted risk crosses a critical threshold of 80%, EdgeGuard automatically triggers a relay through GPIO 26 to isolate the transformer from the electrical network. The system also supports secure remote control, dashboard monitoring, API-key-based hardware authentication, JWT-based user access, WebSocket live updates, and automatic live-hardware detection. With an estimated deployment cost of approximately ₹3,850, EdgeGuard offers a low-cost alternative to conventional transformer monitoring systems. Its cloud-independent operation and edge-based decision-making make it especially useful for rural and semi-urban distribution grids where connectivity and maintenance resources are limited.

28 July 2026
ANALYZING TOXIC USER BEHAVIOR AND RISK PATTERNS IN ONLINE GAMING PLATFORMS
This study shows that behavioral data alone can't reliably predict gaming toxicity — but a risk-based model combining behavioral and engineered features does a much better job of flagging the small segment of high-risk users driving disproportionate harm.