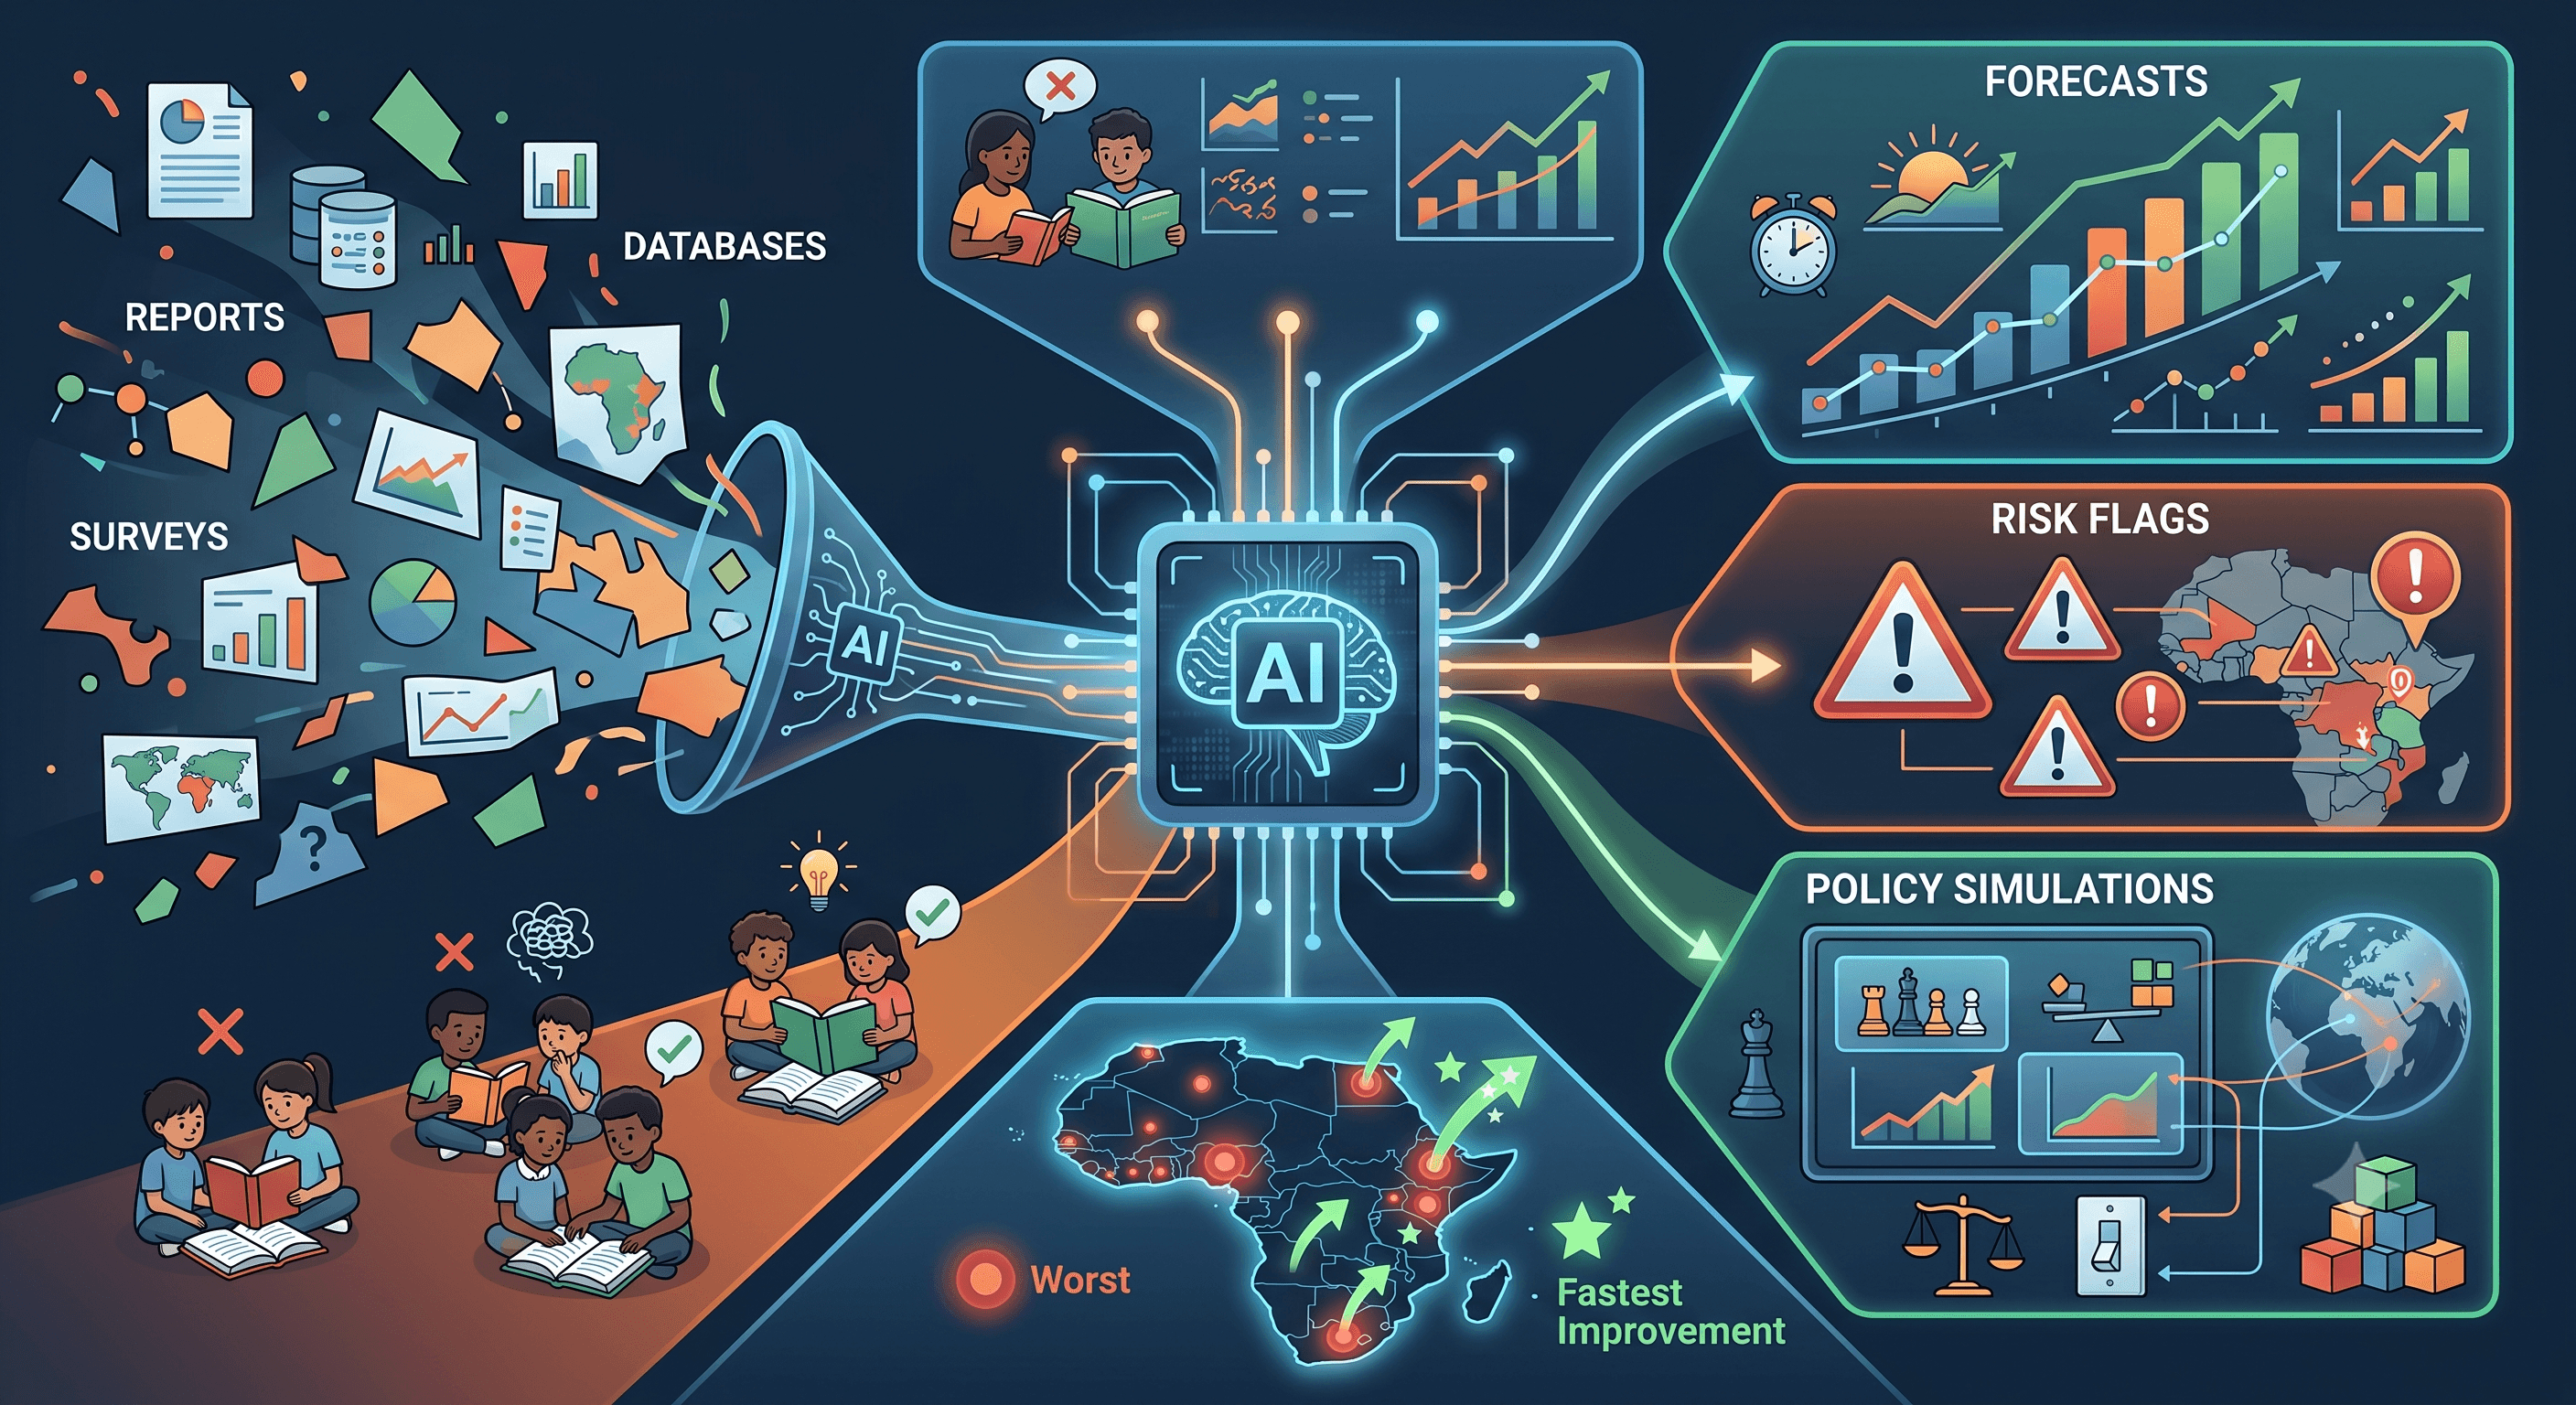
Millions of children finish primary school every year without being able to read a simple sentence. That's what "learning poverty" means — and it's one of the most stubborn global development problems out there. The data to understand it exists, scattered across World Bank spreadsheets, government databases, and survey systems. The problem is that most institutions still process it manually, which means slow reporting, inconsistent country naming, and virtually no predictive intelligence to guide policy before a crisis deepens.
A recent white paper walks through how the Learning Poverty Intelligence Platform, built on Terno AI, tackles this — turning fragmented historical datasets into forecasts, risk flags, and policy simulations through a conversational, prompt-driven workflow. What makes this case study especially interesting is that it doesn't just describe the platform in the abstract — it shows the actual prompts used and the actual outputs generated, end to end, from raw Excel files to an early-warning system.
Here's what that journey looked like.
The Problem: Data Exists, Intelligence Doesn't
Learning poverty is defined as a child's inability to read and understand age-appropriate text by age 10. It disproportionately affects low- and middle-income countries, driven by limited access to quality education, inadequate infrastructure, teacher shortages, and weak monitoring systems.
The core issue isn't a lack of data — it's fragmentation. Education datasets are scattered across Excel spreadsheets, government databases, and international reporting frameworks, often containing missing values, duplicate records, inconsistent country naming, and misaligned indicator definitions. Most education systems still rely on descriptive analytics — dashboards that show what happened — rather than predictive analytics that can warn stakeholders about what's coming.
The real-world cost is significant: poor resource allocation, delayed interventions, and reduced educational outcomes, all stemming from the inability to see trends coming.
The Platform: Five Layers, One Workflow
The Learning Poverty Intelligence Platform is architected across five layers:
- Data Ingestion — historical learning poverty datasets, education surveys, World Bank indicators, government records
- Data Transformation — schema alignment, missing value imputation, normalization
- Feature Engineering — lag indicators, rolling averages, trend statistics
- Machine Learning Engine — LightGBM, CatBoost, and time series forecasting models
- Explainable AI & Visualization — interactive dashboards designed for transparency and stakeholder trust
It's built for ministries of education, international development organizations, NGOs, researchers, and policy analysts — anyone who needs to go from raw indicator data to an actionable forecast without a dedicated data science team.
Walking Through the Analysis: From Three Messy Files to One Clean Dataset
Step 1: Combining Fragmented Sources
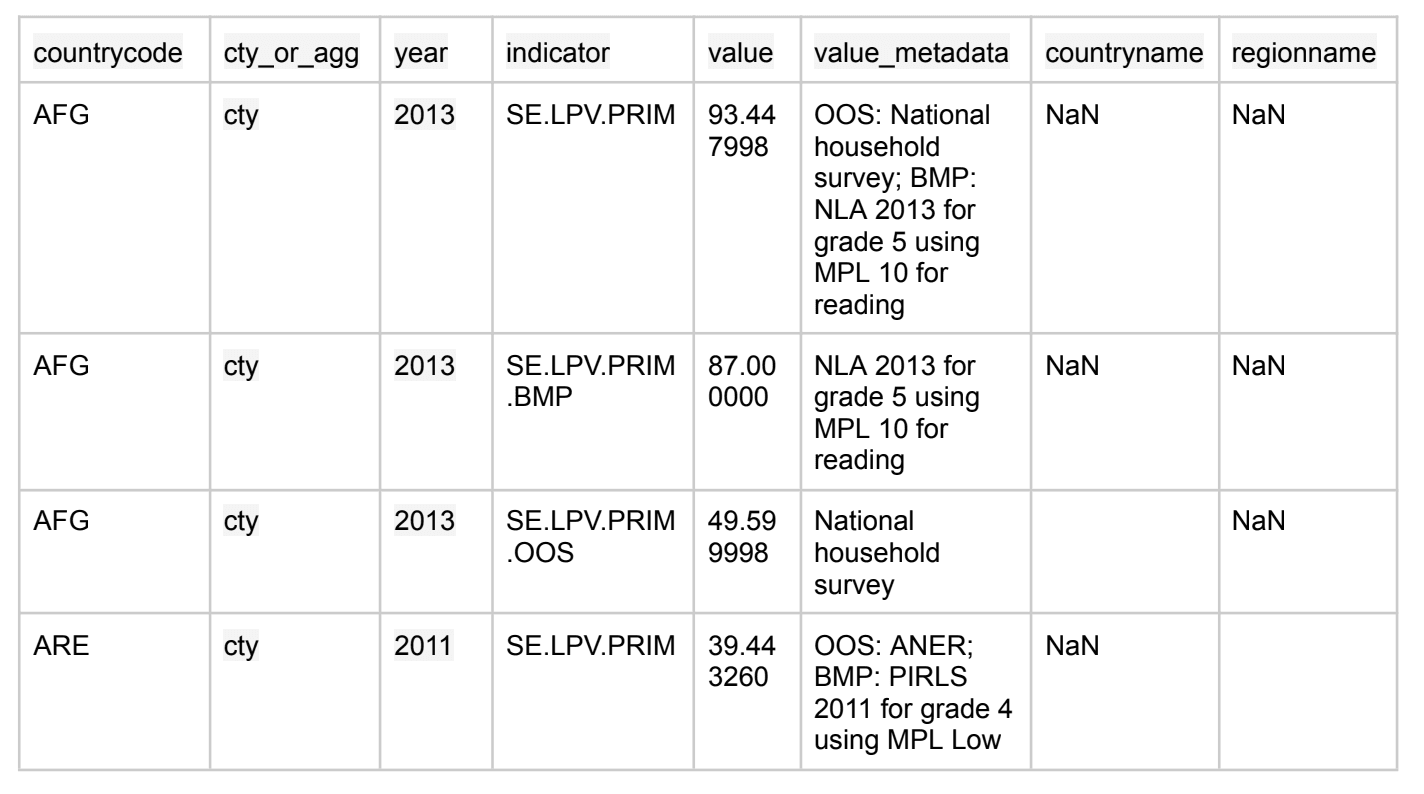
The implementation started with three separate Excel files — lpv_edstats.xls, lpv_edstats_1205.xls, and lpv_edstats_1303.xls — all containing pieces of the Learning Poverty Global Database. A simple natural-language prompt to Terno AI ("can you combine the three files to make one major csv file for data analysis") produced a single harmonized dataset with consistent columns: country code, year, indicator, value, and metadata.
Step 2: Exploring What Was There
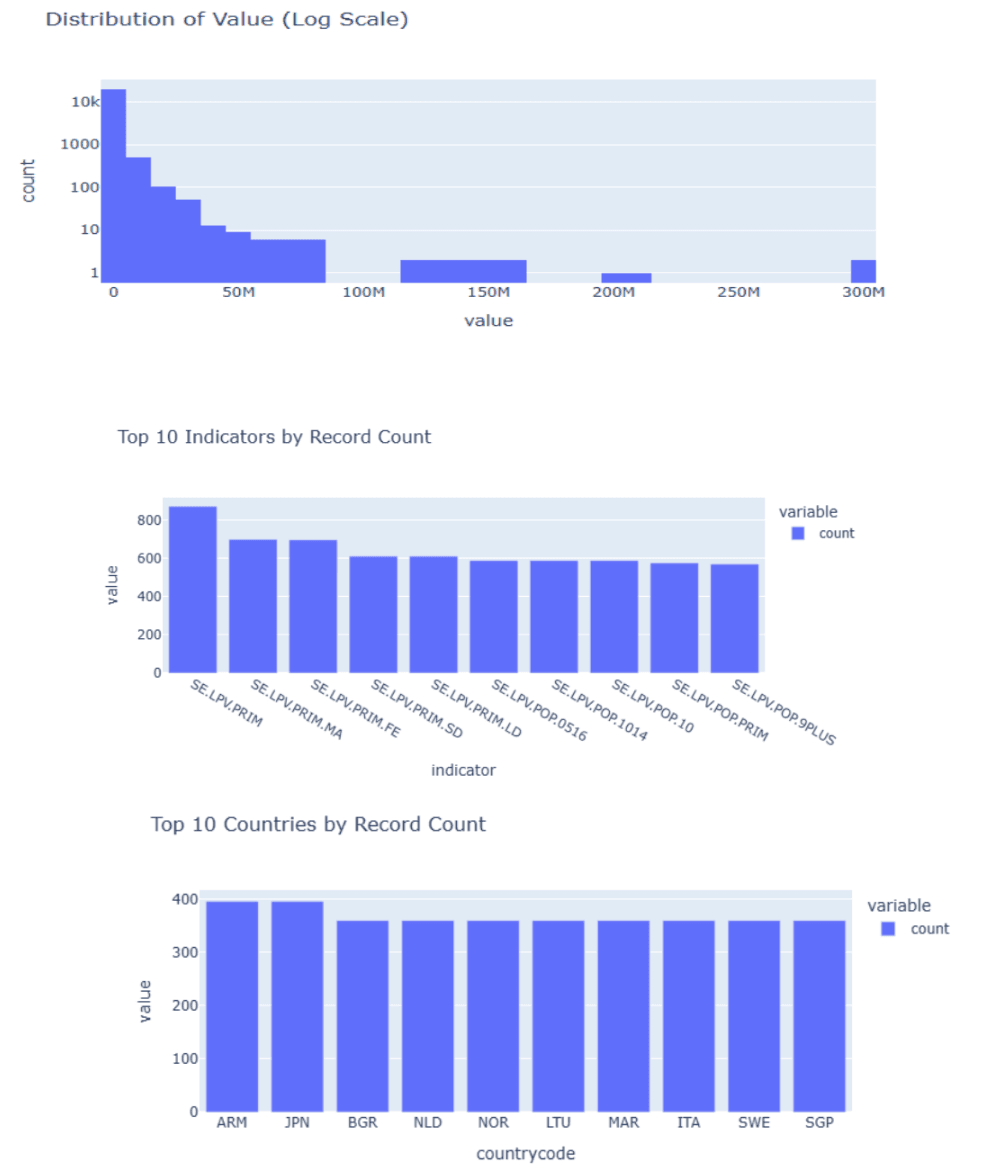
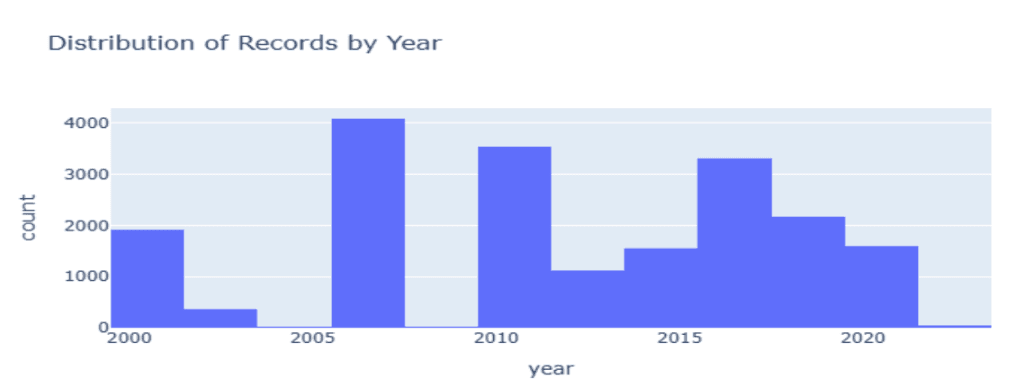
Initial EDA on the combined file revealed the scale of the challenge:
19,753 records, 8 columns
147 unique countries, 42 unique indicators, 17 years, 7 regions
Numeric values ranging from -0.2 to over 301 million — a sign that the "value" column mixed percentage rates with raw population counts
2,367 missing values in country name and region name columns
Step 3: Cleaning and Optimizing
Given the scale of missing and inconsistent data, the dataset was cleaned before any modeling began:
2,162 duplicate records removed
17,590 records remaining
All columns standardized (lowercase, underscores)
One negative/invalid value removed
Data types optimized for memory efficiency (categorical codes, float32 values, int16 years)
Missing country/region names reduced from 2,367 down to 384 by mapping available data
Digging into that remaining 384, it turned out these weren't real gaps at all — they were aggregate codes (regional or income-group groupings like EAP = East Asia & Pacific, HIC = High Income Countries, LIC = Low Income Countries) rather than actual countries, so they naturally lacked a country name or region.
A small but telling catch during this process: the platform labeled the United Arab Emirates with the country code ARE — the correct ISO standard code — even though the analyst initially expected the more familiar "UAE." It's a useful reminder that automated pipelines follow formal standards, which can occasionally surprise a human reviewer used to informal conventions.
Step 4: Making It Model-Ready
The final preprocessing step added an is_aggregate flag (True for regional/income-group rows, False for actual countries) and confirmed there were no missing values left in any key feature — leaving a clean, feature-ready dataset of 17,590 records across 9 columns.
What the Data Revealed
The Five Countries With the Worst Learning Poverty Rates
| Rank | Country | Region | Highest Learning Poverty Rate (%) |
|---|---|---|---|
| 1 | Niger | Sub-Saharan Africa | 98.72 |
| 2 | Zambia | Sub-Saharan Africa | 98.50 |
| 3 | Chad | Sub-Saharan Africa | 97.81 |
| 4 | Lao PDR | East Asia and Pacific | 97.72 |
| 5 | Lesotho | Sub-Saharan Africa | 97.01 |
Four of the five worst-affected countries are in Sub-Saharan Africa — a clear enough pattern that the analysis deliberately shifted focus toward that region to understand root causes.
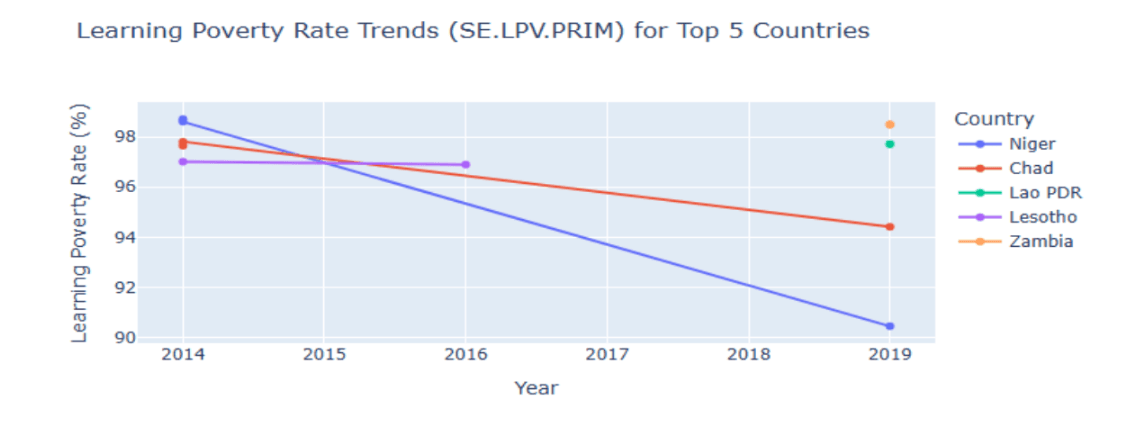
Looking at the trend over time, Niger showed the sharpest decline (moving from the high-90s down toward 90%), while Chad, Lao PDR, Lesotho, and Zambia stayed persistently high with little movement.
What's Actually Driving These Numbers
| Country | Learning Poverty (%) | Below Minimum Proficiency (%) | Learning Deprivation (%) | Out-of-School Rate (%) | Schooling Deprivation (%) |
|---|---|---|---|---|---|
| Chad | 94.4 | 97.0 | 92.4 | 21.1 | 26.5 |
| Lao PDR | 97.7 | — | 97.5 | — | 8.5 |
| Lesotho | 96.9 | — | 96.6 | — | 8.8 |
| Niger | 90.4 | 97.9 | 85.6 | 38.9 | 33.5 |
| Zambia | 98.5 | — | 98.2 | — | 14.9 |
The pattern here is telling: even children who are in school are overwhelmingly failing to reach basic reading proficiency (Chad: 97%, Niger: 97.9%). And in Niger and Chad specifically, high out-of-school rates (39% and 21%) show that access to schooling itself is a major additional barrier — not just what happens once children arrive.
Digging deeper into the underlying drivers of low reading proficiency in Niger and Chad surfaced eight structural factors:
- Low access to quality education — limited or no schools in rural/remote areas, lacking infrastructure and trained teachers
- Language barriers — instruction often isn't in the child's mother tongue, and local-language reading materials are scarce
- Teacher shortages and training gaps — too few qualified teachers, limited training in reading instruction
- Poverty and socioeconomic challenges — malnutrition, child labor, and cost barriers to attendance
- Conflict and instability — school closures and disrupted learning
- Gender disparities — girls face extra barriers like early marriage and household responsibilities
- Limited early childhood education — very low pre-primary enrollment, missing foundational skill-building
- Weak education system governance — limited funding, weak policy implementation, insufficient monitoring
The Global Picture: Who's Improving, Who Isn't
Looking beyond just the worst-affected countries, the platform surfaced which countries have made the most progress — and which have slipped backward — over their most recent five-year data window.
Top 5 improvers:
| Rank | Country | Prior Year | Prior Value (%) | Latest Year | Latest Value (%) | Improvement (pp) |
|---|---|---|---|---|---|---|
| 1 | Benin | 2014 | 77.97 | 2019 | 55.78 | 22.20 |
| 2 | Congo, Rep | 2014 | 84.70 | 2019 | 70.01 | 14.68 |
| 3 | Qatar | 2016 | 35.01 | 2021 | 21.06 | 13.96 |
| 4 | Egypt, Arab Rep | 2016 | 69.63 | 2021 | 56.12 | 13.51 |
| 5 | Burkina Faso | 2014 | 83.00 | 2019 | 73.86 | 9.14 |
Bottom 5 (worsening) countries:
| Rank | Country | Prior Year | Prior Value (%) | Latest Year | Latest Value (%) | Change (pp) |
|---|---|---|---|---|---|---|
| 1 | Azerbaijan | 2016 | 25.18 | 2021 | 37.55 | -12.37 |
| 2 | Kazakhstan | 2016 | 3.11 | 2021 | 10.41 | -7.30 |
| 3 | Iran, Islamic Rep | 2016 | 35.25 | 2021 | 41.54 | -6.29 |
| 4 | Latvia | 2016 | 3.67 | 2021 | 8.44 | -4.77 |
| 5 | Israel | 2016 | 11.42 | 2021 | 14.40 | -2.98 |
For context, the unweighted global average improvement over the same kind of five-year window was just 1.10 percentage points — dwarfed by Benin's 22.20-point gain, and starkly different from the outright worsening seen in Azerbaijan and Kazakhstan.
Regional Patterns
| Region | Average Improvement (pp) |
|---|---|
| Sub-Saharan Africa | 6.01 |
| Middle East and North Africa | 4.67 |
| Latin America and Caribbean | 2.31 |
| East Asia and Pacific | -0.69 |
| Europe and Central Asia | -1.48 |
| North America | -1.76 |
Interestingly, Sub-Saharan Africa — home to the worst absolute learning poverty rates — is also the region making the most improvement on average. Meanwhile, regions with comparatively lower learning poverty (East Asia and Pacific, Europe and Central Asia, North America) actually saw slight worsening over the same period, a reminder that "improving from a low starting point" and "already doing well" are two very different stories.
What's Working: Evidence From Real Programs
The platform didn't just identify problems — it was prompted to surface real-world examples of interventions that worked:
| Country/Region | Funding Focus | Measurable Improvement |
|---|---|---|
| Kenya (Tusome Program) | Early grade reading | Doubled reading proficiency (2015–2018) |
| Vietnam | System-wide, foundational skills | High reading proficiency, low learning poverty |
| Rwanda | Teacher quality, materials | Higher literacy rates |
| Brazil (Ceará) | Incentives, teacher training | Dramatic literacy improvements |
| Ethiopia (GEQIP) | Textbooks, training, school grants | Better reading/math scores, higher enrollment |
The common threads across all five: targeted spending (on teachers, materials, and foundational skills) beats general budget increases, accountability and monitoring are essential to turning funding into results, and sustained investment over several years — not a one-time injection — is what produces lasting change.
Simulating "What If": Policy Scenario Modeling
One of the platform's more distinctive capabilities is letting a user simulate hypothetical policy changes and see projected outcomes — without waiting years to find out in the real world.
What would a 15% funding increase actually pay for?
Based on global best practices, a hypothetical 15% funding increase for countries like Niger and Chad was modeled to allocate as follows:
Teacher Salaries & Recruitment: 35%
School Infrastructure: 25%
Learning Materials: 15%
Teacher Training: 10%
Early Childhood Education: 8%
Monitoring & Evaluation: 7%
What would it cost?
Using global cost benchmarks for foundational literacy programs (roughly $3–$20 per child per year, depending on program comprehensiveness), the platform built a cost estimate for scaling a program to reach 1 million primary school children:
| Component | Cost Estimate (USD per child/year) |
|---|---|
| Teacher training | $2 |
| Student textbooks | $1 |
| Teacher guides | $0.50 |
| Coaching/support | $1 |
| Monitoring/Evaluation | $0.50 |
| Total | $5 |
Scaled up, that puts a comprehensive national program — including school grants — in the range of $10–$15 million per year for a country the size of Niger or Chad.
What would it actually achieve?
Projecting a 15% funding increase forward five years (2024–2028) across the five highest-poverty countries, the model estimated a reduction in learning poverty of roughly 1.58 percentage points (relative) — for example, taking Niger's projected 2024 rate from 82.2% down to about 80.9%. It's a modest, not dramatic, effect on its own — which reinforces the earlier finding that funding needs to be paired with well-targeted, sustained interventions to move the needle meaningfully.
Looking Ahead: Prediction and Early Warning
The final piece of the platform is a genuinely predictive layer: a RandomForestRegressor model trained to forecast learning poverty rates across country-year combinations, with an early warning system flagging any case where predicted learning poverty exceeds a 60% threshold.
| Country | Year | Predicted Learning Poverty (%) | Risk Status |
|---|---|---|---|
| Qatar | 2019 | 69.13 | At Risk |
| Kazakhstan | 2019 | 66.04 | At Risk |
| Egypt | 2019 | 57.88 | Not at Risk |
| Benin | 2019 | 51.58 | Not at Risk |
| Azerbaijan | 2019 | 50.16 | Not at Risk |
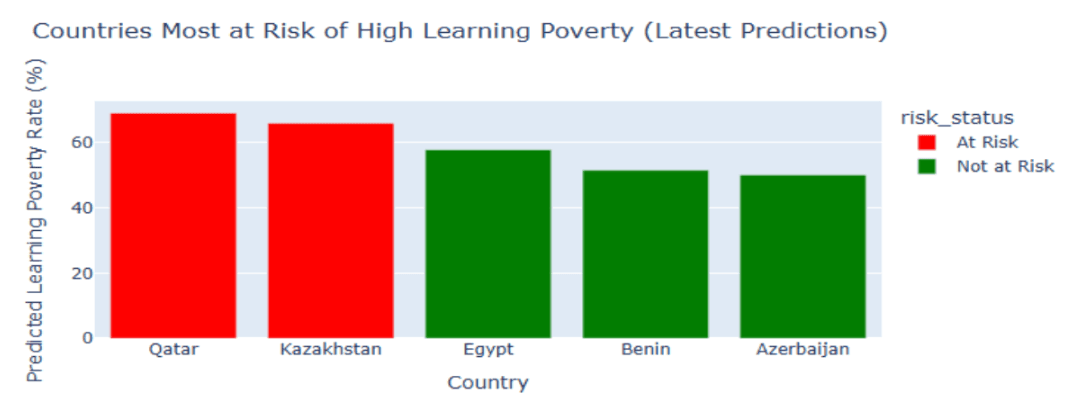
This kind of early-warning flagging is exactly the "predictive rather than reactive" capability the platform set out to build — surfacing which countries are trending toward crisis levels before the situation fully materializes, so interventions can be planned proactively rather than after the fact.
Why Reducing Learning Poverty Matters Economically
Beyond the humanitarian case, the analysis also surfaced the macroeconomic argument for investing in foundational literacy:
Each additional year of schooling raises average annual GDP growth by roughly 0.37 percentage points — but only when real learning occurs, not just attendance.
A 10% increase in the share of students reaching minimum reading proficiency can raise a country's GDP growth rate by an estimated 0.3–0.5 percentage points per year over the long term.
Reducing learning poverty also reduces intergenerational poverty, since foundational literacy underpins higher educational attainment, better job prospects, and greater lifetime earnings.
In short: this isn't purely a social outcome — it's tied directly to national productivity and economic competitiveness.
Key Takeaways
- Fragmented data is solvable with the right workflow. Three inconsistent Excel files became one clean, model-ready dataset through a straightforward, prompt-driven pipeline.
- Learning poverty is concentrated, but not permanent. Sub-Saharan Africa holds the worst rates — but is also improving the fastest, proof that progress is achievable even from a difficult starting point.
- The problem isn't just "getting kids into school." Even among enrolled children, proficiency rates remain devastatingly low — pointing to teacher quality, language of instruction, and curriculum as equally critical levers.
- Funding alone isn't enough. The countries that succeeded (Kenya, Vietnam, Rwanda, Brazil, Ethiopia) paired funding increases with targeted, accountable, sustained interventions.
- Policy simulation turns guesswork into evidence. Modeling a 15% funding increase gave a concrete, if modest, projected outcome — useful for setting realistic expectations before committing resources.
- Prediction beats reaction. An early warning system that flags at-risk countries before rates spiral further gives policymakers a genuine head start.
Why This Matters
This case study is a strong example of what's possible when messy, real-world development data meets a conversational analytics platform. Every step — from combining raw files, to cleaning and feature engineering, to forecasting and policy simulation — happened through plain-language prompts rather than custom code, making this kind of analysis accessible to education researchers and policy analysts who aren't data scientists by training. For a problem as urgent and global as learning poverty, that accessibility might matter just as much as the predictive accuracy itself.
Read the full white paper here

18 August 2026
The Honest Number Was 83%: Leakage, Abstention, and a Complaint Router You Can Actually Deploy
The same complaint-routing model scores 96.3% or 83.2% depending on which three columns you leave in the training data. The high number is the intake form being read back to you. This is what the leakage audit found before a single model was trained, why 83.2% is the honest figure, and how the same model — given permission to say "I don't know" — becomes deployable at 90.7% accuracy on 79.5% of traffic.

29 July 2026
EdgeGuard: AI-Driven Predictive Maintenance for Power Transformers
Power transformers are among the most critical assets in electrical distribution infrastructure. Their unexpected failure can result in power outages, safety hazards, equipment damage, expensive repairs, and long service interruptions. Traditional transformer maintenance practices often rely on periodic manual inspection, offline testing, or run-to-failure maintenance. These methods are expensive, slow, labor-intensive, and unable to detect rapidly developing faults in real time. EdgeGuard is an AI-driven, edge-computing predictive maintenance system designed to continuously monitor transformer health and forecast failures before catastrophic damage occurs. The system acts as a retrofittable “Digital Doctor” for distribution transformers by combining low-cost industrial sensors, an ESP32 microcontroller, local intelligence, machine learning-based risk prediction, autonomous relay control, and a real-time web dashboard. The proposed system monitors six major transformer health indicators: temperature, humidity, vibration, oil level, current, and voltage. These signals are normalized and processed through a Multi-Layer Perceptron neural network to classify transformer condition and estimate failure risk. If the predicted risk crosses a critical threshold of 80%, EdgeGuard automatically triggers a relay through GPIO 26 to isolate the transformer from the electrical network. The system also supports secure remote control, dashboard monitoring, API-key-based hardware authentication, JWT-based user access, WebSocket live updates, and automatic live-hardware detection. With an estimated deployment cost of approximately ₹3,850, EdgeGuard offers a low-cost alternative to conventional transformer monitoring systems. Its cloud-independent operation and edge-based decision-making make it especially useful for rural and semi-urban distribution grids where connectivity and maintenance resources are limited.

28 July 2026
ANALYZING TOXIC USER BEHAVIOR AND RISK PATTERNS IN ONLINE GAMING PLATFORMS
This study shows that behavioral data alone can't reliably predict gaming toxicity — but a risk-based model combining behavioral and engineered features does a much better job of flagging the small segment of high-risk users driving disproportionate harm.