
Introduction: The Power of Data Science
Data science is a cornerstone of modern decision-making. It helps organizations uncover hidden patterns, forecast outcomes, and make data-informed decisions using a mix of statistics, programming, and domain knowledge.
But what if you could do all this—without writing code?
That’s where TernoAI comes in. It's a powerful AutoML tool that takes natural language prompts and turns them into complete data science workflows, from EDA to model evaluation.
Project Setup: Uploading Kaggle's Medical Cost Dataset to TernoAI
To begin this analysis, I manually downloaded the Medical Cost Personal Dataset from Kaggle, which contains 1,338 records of individual health profiles alongside their annual medical insurance charges.
After downloading the insurance.csv file, I uploaded it directly to TernoAI.
About the Dataset
The dataset includes the following features:
| Column | Description |
|---|---|
| age | Age of the individual |
| sex | Gender (male/female) |
| BMI | Body Mass Index |
| children | Number of dependents covered |
| smoker | Smoking status (yes/no) |
| region | Region of residence (southeast, northwest, etc.) |
| charges | Annual medical insurance cost (target variable) |
With just one upload, the dataset was ready for immediate exploration—no extra setup, no dependency headaches.
The Challenge: Predicting Medical Insurance Costs
With the data successfully uploaded into TernoAI, the core objective was to build a machine-learning model that could predict annual medical insurance costs based on individual attributes like age, BMI, smoking status, and region.
This task isn’t just about prediction—it also offers opportunities to:
Identify cost drivers
Enable personalized premium strategies.
Guide public health interventions based on behavioral patterns (e.g., smoking)
Using Terno AI: From Command to Workflow
Instead of writing code manually, I used Terno AI, a smart AutoML assistant that responds to plain English commands. My first prompt was:
“Perform exploratory data analysis on the Medical Cost Personal Dataset, including summary statistics, missing value analysis, duplicate value analysis, and visualizations for key features.”
From this single prompt, TernoAI instantly delivered:
Cleaned and analyzed the dataset
Handled missing/duplicate checks
Generated insightful visualizations
Prepared the data for modeling
Exploratory Data Analysis (EDA)
Summary Statistics
TernoAI computed key stats for numeric features:
| Feature | Mean | Std Dev | Min | Max |
|---|---|---|---|---|
| Age | 39.2 | 14.0 | 18 | 64 |
| BMI | 30.7 | 6.1 | 15.96 | 53.13 |
| Charges | 13,270 | 12,100 | 1,122 | 63,770 |
Insight: Medical charges exhibit high variance and are skewed to the right, indicating that a few individuals incur significantly higher costs.
Missing & Duplicate Values
TernoAI reported:
Missing Values: None
Duplicate Rows: 1 duplicate found and handled
The dataset was clean and ready for analysis.
Visual Insights
- Distributions and Categorical Counts
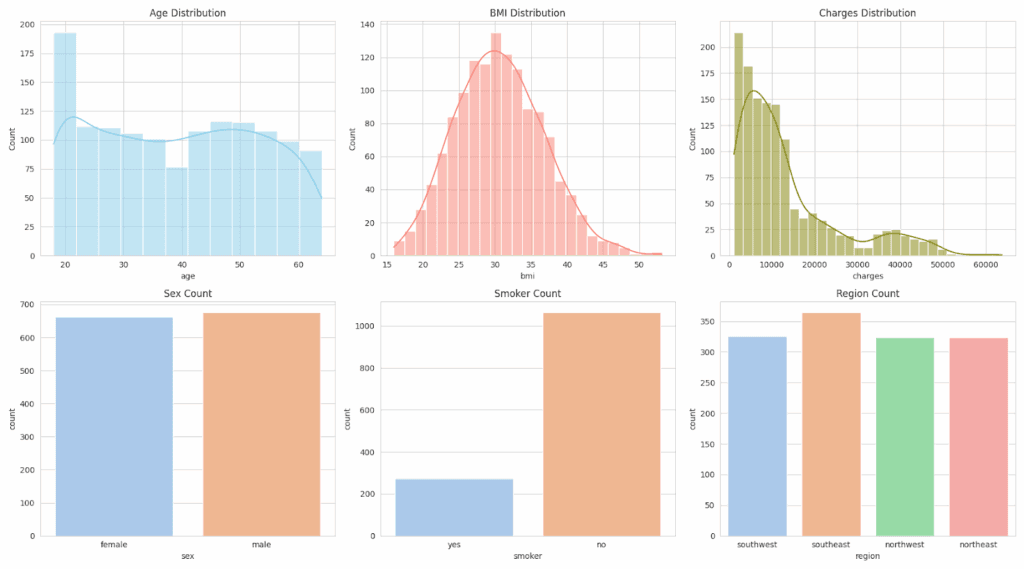
This figure provides an overview of the data distribution across both numerical and categorical features.
Histograms show the shape and skewness of continuous variables like age, BMI, and charges.
Count plots reveal the balance across sex, smoker, and region.
Notably, charges are highly skewed, and the dataset has more non-smokers than smokers.
- Relationships Between Features and Medical Charges
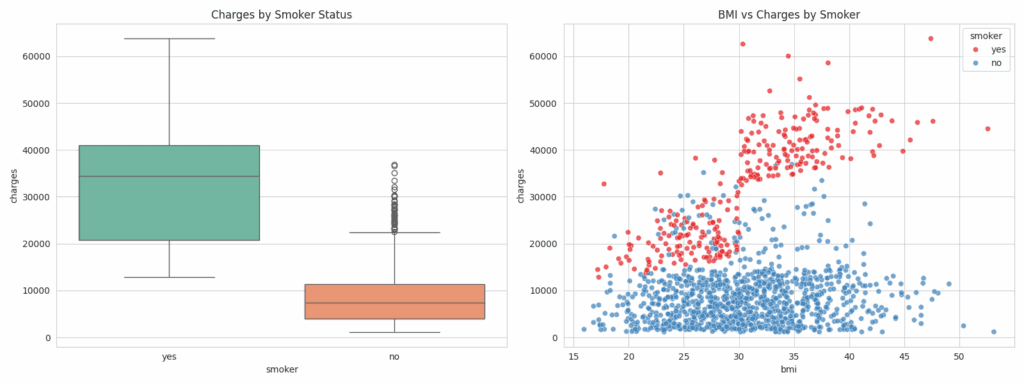
This figure explores how smoker status and BMI relate to insurance charges.
The boxplot shows that smokers have substantially higher charges, confirming that smoking is a key cost driver.
The scatterplot of BMI vs charges, colored by smoker, reveals that higher BMI correlates with higher costs, especially among smokers.
Model Building and Evaluation
Before diving into modeling, I wanted to evaluate which machine learning algorithms could best distinguish between high-cost and low-cost individuals using the available features.
My Prompt:
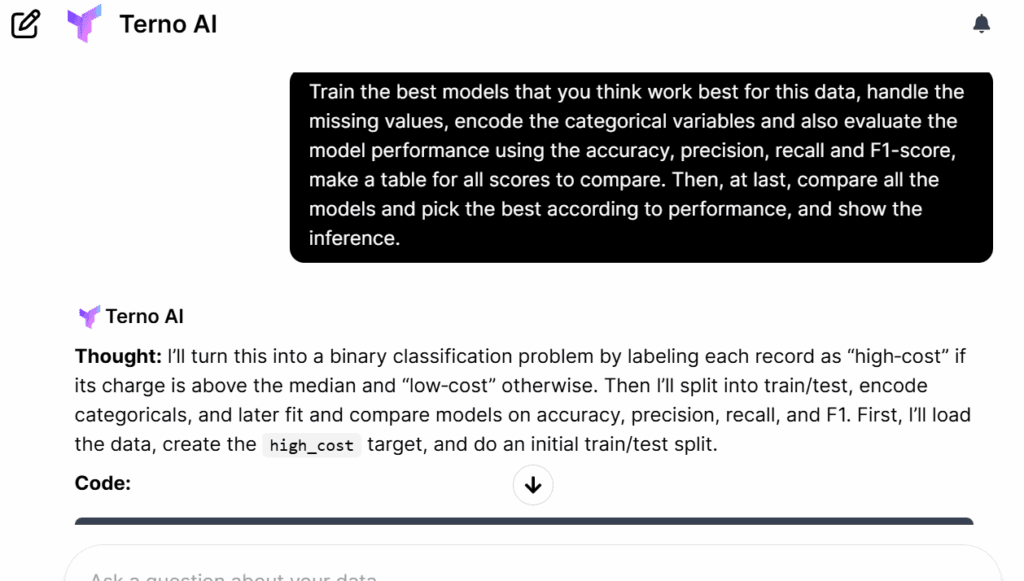
“Train the best models that you think work best for this data, handle the missing values, encode the categorical variables and also evaluate the model performance using the accuracy, precision, recall and F1-score, make a table for all scores to compare. Then, at last, compare all the models and pick the best according to performance, and show the inference.”
Problem Framing
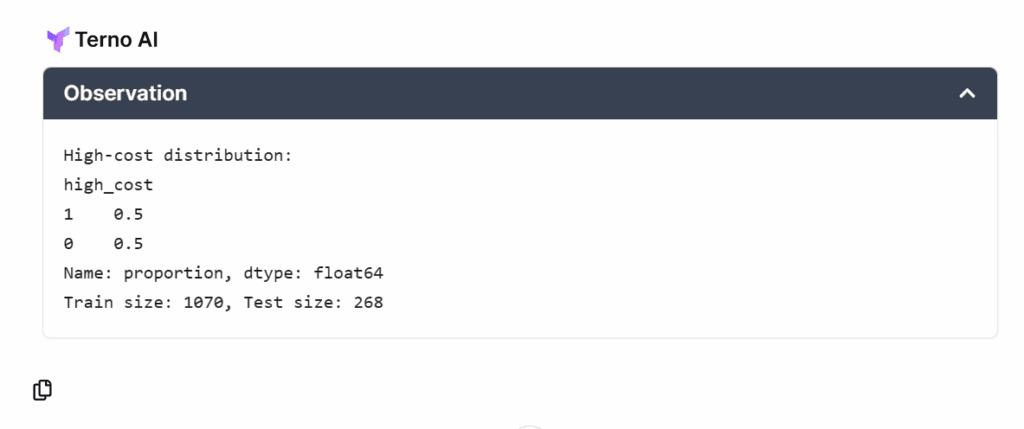
To simplify prediction, TernoAI transformed the problem into a binary classification task:
1 = High-cost individual
0 = Low-cost individual
This made it easier to train classification models that predict cost categories, a valuable feature for insurers.
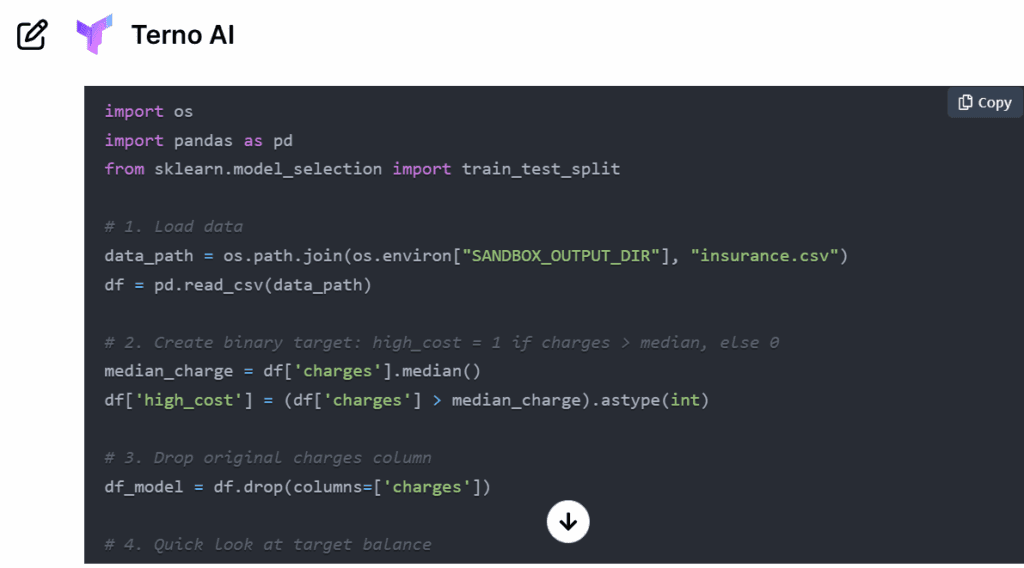
TernoAI built complete training pipelines for the following models:
Logistic Regression
Decision Tree
Random Forest
Gradient Boosting
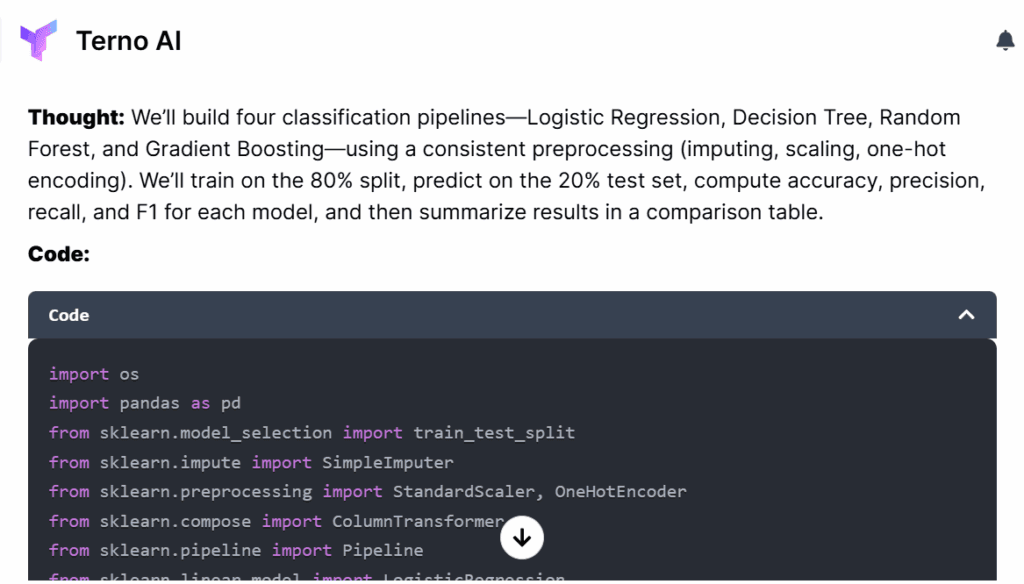
All preprocessing steps were automated:
One-hot encoding
Scaling
Train-test splitting (80/20)
Model Evaluation Results
| Model | Accuracy | Precision | Recall | F1-Score |
|---|---|---|---|---|
| Logistic Regression | 0.8993 | 0.8849 | 0.9179 | 0.9011 |
| Decision Tree | 0.8806 | 0.8806 | 0.8806 | 0.8806 |
| Random Forest | 0.9366 | 0.9680 | 0.9030 | 0.9344 |
| Gradient Boosting | 0.9291 | 0.9528 | 0.9030 | 0.9272 |
| Best Model: Random Forest |
Highest accuracy and F1-score**
**Excellent tradeoff between precision and recall
Visual Comparison of Model Performance
TernoAI generated a grouped bar chart to compare performance metrics visually.
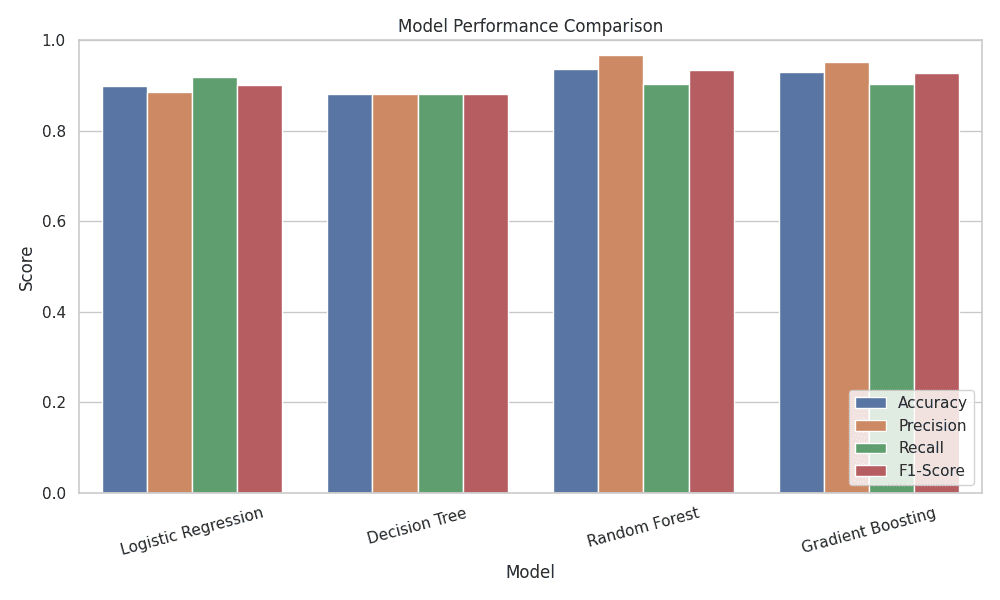
According to the chart, Random Forest outperforms across all four metrics.
Feature Correlation Analysis
To gain deeper insight into what drives medical costs, I asked:
My Prompt:
“So what is your conclusion on what features have the best correlation with medical insurance and which have the worst?”
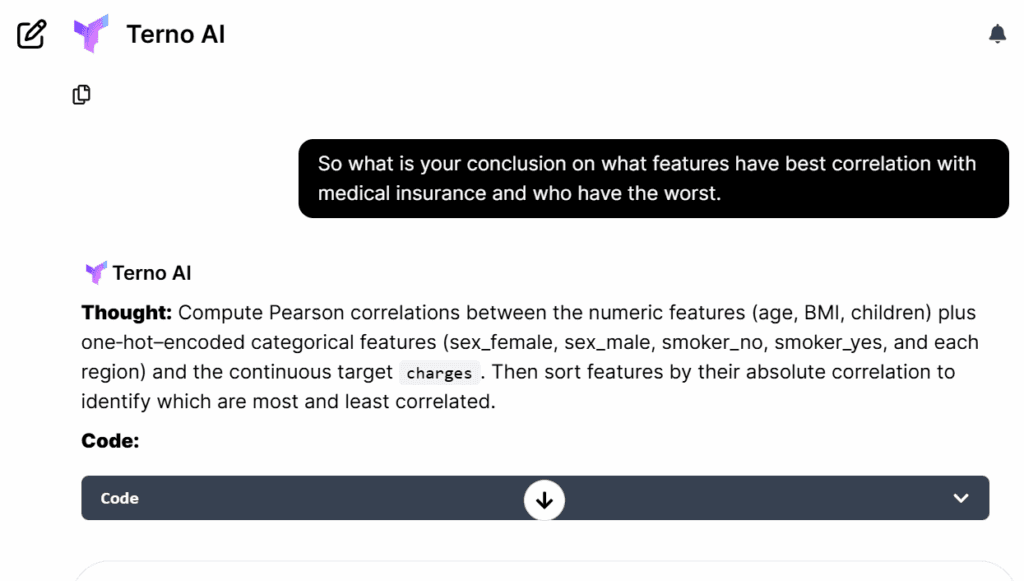
TernoAI computed Pearson correlations between features and charges:
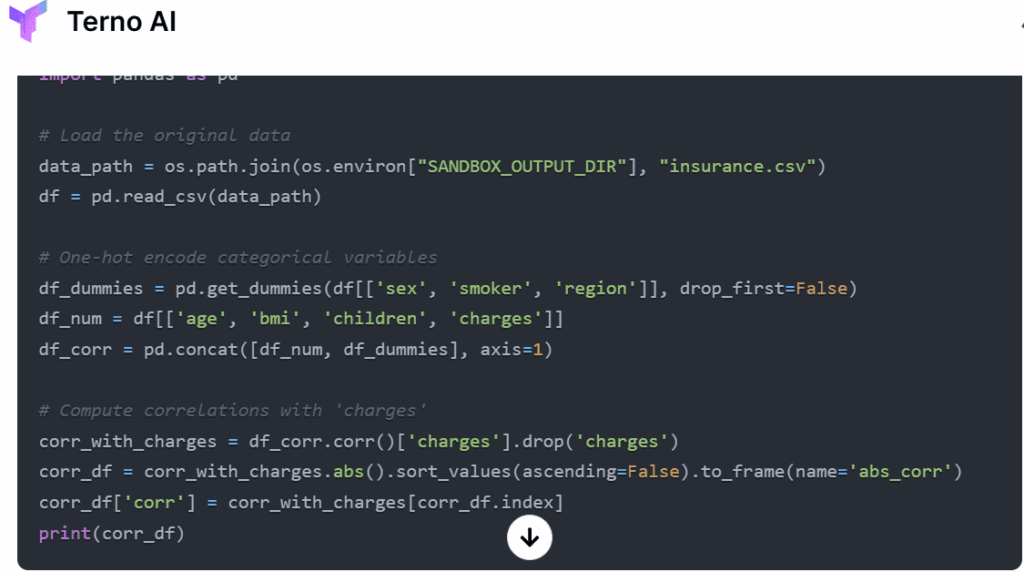
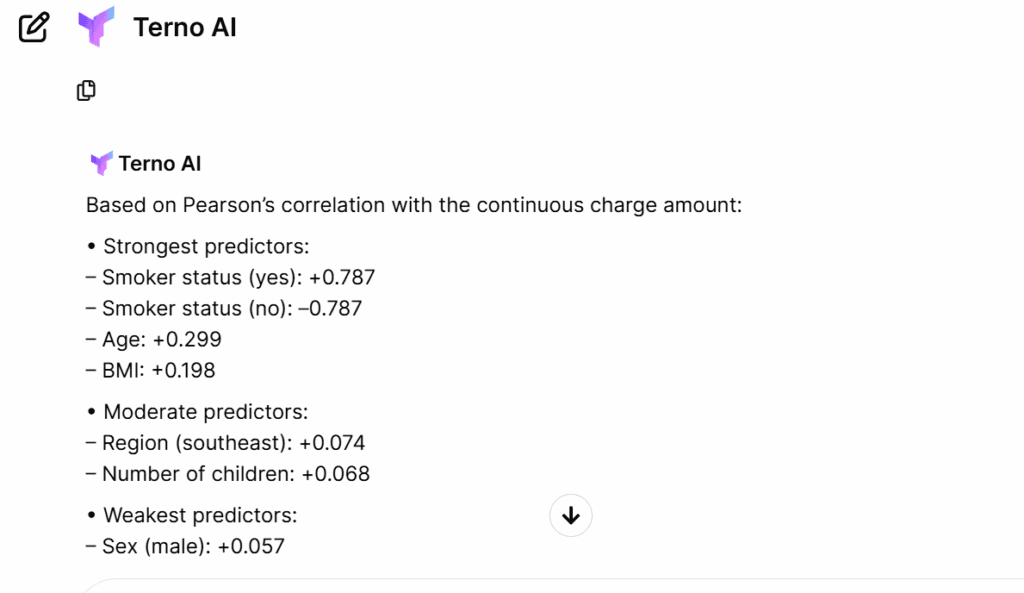
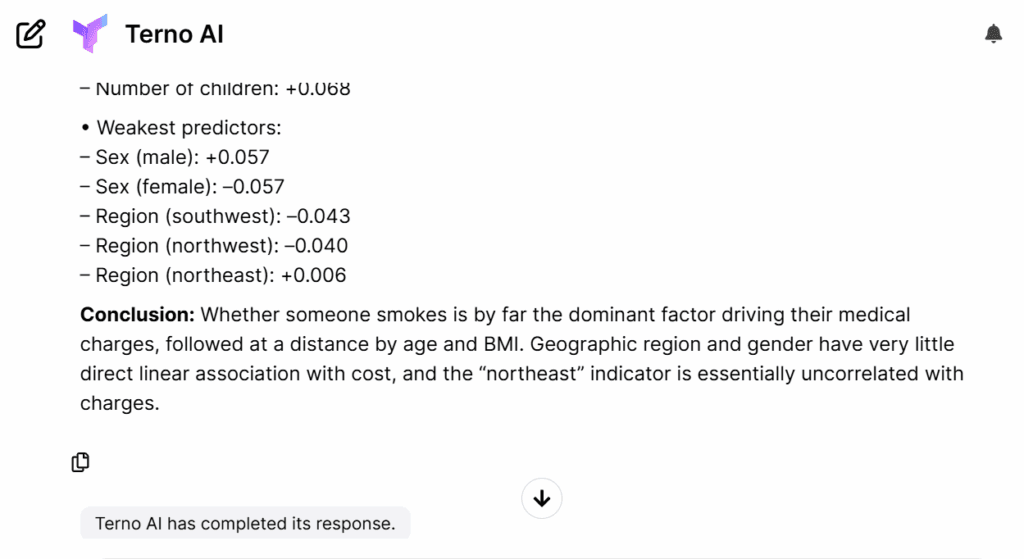
Top Correlated Features:
| Feature | Correlation |
|---|---|
| Smoker (yes) | +0.787 |
| Age | +0.299 |
| BMI | +0.198 |
| Children | +0.067 |
| Region/Sex | ~0.00 |
| Interpretation: |
Smoking is the strongest single-cost predictor
Age and BMI are moderate cost drivers.
Sex and region have minimal impact.
Conclusion: What TernoAI Helped Me Achieve
With minimal input and zero manual coding, TernoAI helped me:
Clean and explore the dataset
Visualize important relationships
Convert a regression problem into a classification problem.
Train and evaluate four machine learning models.
Identify top predictors of healthcare costs.
Choose the best model (Random Forest) based on strong metrics.
Key Insights:
Smoking is the most influential driver of medical costs.
Random Forest was the best-performing model.
TernoAI automated the entire analysis pipeline—cleanly and correctly.
Why You Should Try TernoAI
If you're:
A beginner who wants to analyze data without coding
A professional looking to automate repetitive tasks
A data scientist who wants a second brain
Then TernoAI is your AI co-pilot. With just a natural language command, I got full-scale machine learning analysis, reproducible code, visuals, and performance metrics—faster than ever before.
You just have to:
Upload your dataset
Type what you want
Get results, models, code, and plots instantly
No notebooks. No config files. Just results.

18 August 2026
The Honest Number Was 83%: Leakage, Abstention, and a Complaint Router You Can Actually Deploy
The same complaint-routing model scores 96.3% or 83.2% depending on which three columns you leave in the training data. The high number is the intake form being read back to you. This is what the leakage audit found before a single model was trained, why 83.2% is the honest figure, and how the same model — given permission to say "I don't know" — becomes deployable at 90.7% accuracy on 79.5% of traffic.

29 July 2026
EdgeGuard: AI-Driven Predictive Maintenance for Power Transformers
Power transformers are among the most critical assets in electrical distribution infrastructure. Their unexpected failure can result in power outages, safety hazards, equipment damage, expensive repairs, and long service interruptions. Traditional transformer maintenance practices often rely on periodic manual inspection, offline testing, or run-to-failure maintenance. These methods are expensive, slow, labor-intensive, and unable to detect rapidly developing faults in real time. EdgeGuard is an AI-driven, edge-computing predictive maintenance system designed to continuously monitor transformer health and forecast failures before catastrophic damage occurs. The system acts as a retrofittable “Digital Doctor” for distribution transformers by combining low-cost industrial sensors, an ESP32 microcontroller, local intelligence, machine learning-based risk prediction, autonomous relay control, and a real-time web dashboard. The proposed system monitors six major transformer health indicators: temperature, humidity, vibration, oil level, current, and voltage. These signals are normalized and processed through a Multi-Layer Perceptron neural network to classify transformer condition and estimate failure risk. If the predicted risk crosses a critical threshold of 80%, EdgeGuard automatically triggers a relay through GPIO 26 to isolate the transformer from the electrical network. The system also supports secure remote control, dashboard monitoring, API-key-based hardware authentication, JWT-based user access, WebSocket live updates, and automatic live-hardware detection. With an estimated deployment cost of approximately ₹3,850, EdgeGuard offers a low-cost alternative to conventional transformer monitoring systems. Its cloud-independent operation and edge-based decision-making make it especially useful for rural and semi-urban distribution grids where connectivity and maintenance resources are limited.

28 July 2026
ANALYZING TOXIC USER BEHAVIOR AND RISK PATTERNS IN ONLINE GAMING PLATFORMS
This study shows that behavioral data alone can't reliably predict gaming toxicity — but a risk-based model combining behavioral and engineered features does a much better job of flagging the small segment of high-risk users driving disproportionate harm.