
Introduction
In an era of remote work and digital-first environments, stress has become one of the most underreported yet damaging factors affecting productivity and mental health. Traditional stress monitoring relies on self-reporting — surveys, check-ins, wearables — all of which are intrusive and often ignored. This case study explores a fundamentally different question: can a computer passively detect your stress level just by observing how you type, move your mouse, and switch between applications — without asking you anything?
Problem Statement
Workplace stress is a silent epidemic. According to global reports, over 80% of workers experience work-related stress, yet most organizations have no real-time mechanism to detect it. This case study attempts to build a passive, non-intrusive stress detection system using only behavioral signals from everyday computer usage — keystrokes, mouse movements, application switching, and inactivity periods — paired with self-reported stress labels.
The core question: Can machine learning models predict a user's stress level from passive behavioral signals alone?
Dataset Overview
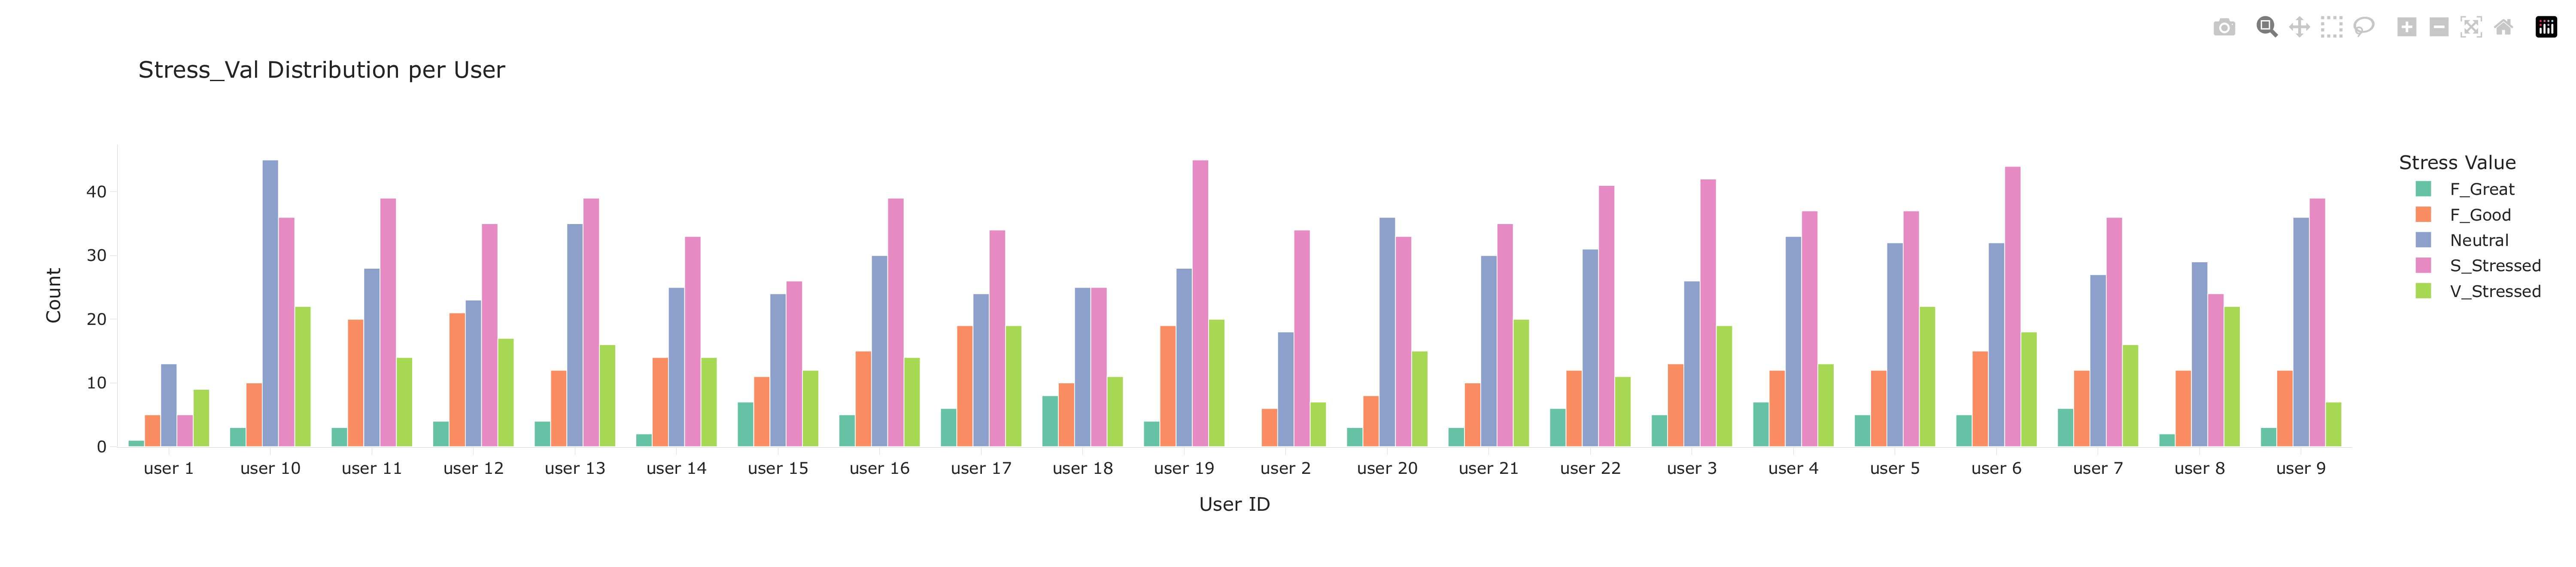
The dataset used is "Stress Detection by Keystroke, App & Mouse Changes" sourced from Kaggle. It contains computer interaction logs from 2 users monitored over approximately one week in September 2021. Every 5 to 30 minutes, users self-reported their mental state across five dimensions: stress, fatigue, energy, pleasantness, and PAM (Photographic Affect Meter) score.
The raw data consisted of six file types per user:
Keystrokes — every key press and release with timestamps (27,000+ events)
Mouse Data — every mouse movement, click, and scroll (4+ million events)
Mouse Movement Speeds — derived speed samples per movement
Inactivity Logs — periods of keyboard and mouse inactivity
Active Windows — foreground application usage log
User Condition — self-reported stress and mood labels (98 rows total)
The central challenge: behavioral data was dense with millions of rows while stress labels were sparse with only 98 entries across both users.
Data Preparation & Feature Engineering
The most critical step in this pipeline was bridging the gap between millions of raw behavioral events and 98 sparse stress labels. A Python script was written to aggregate all behavioral logs into 30-minute lookback windows centered around each label timestamp.
For each self-report entry, the following features were extracted:
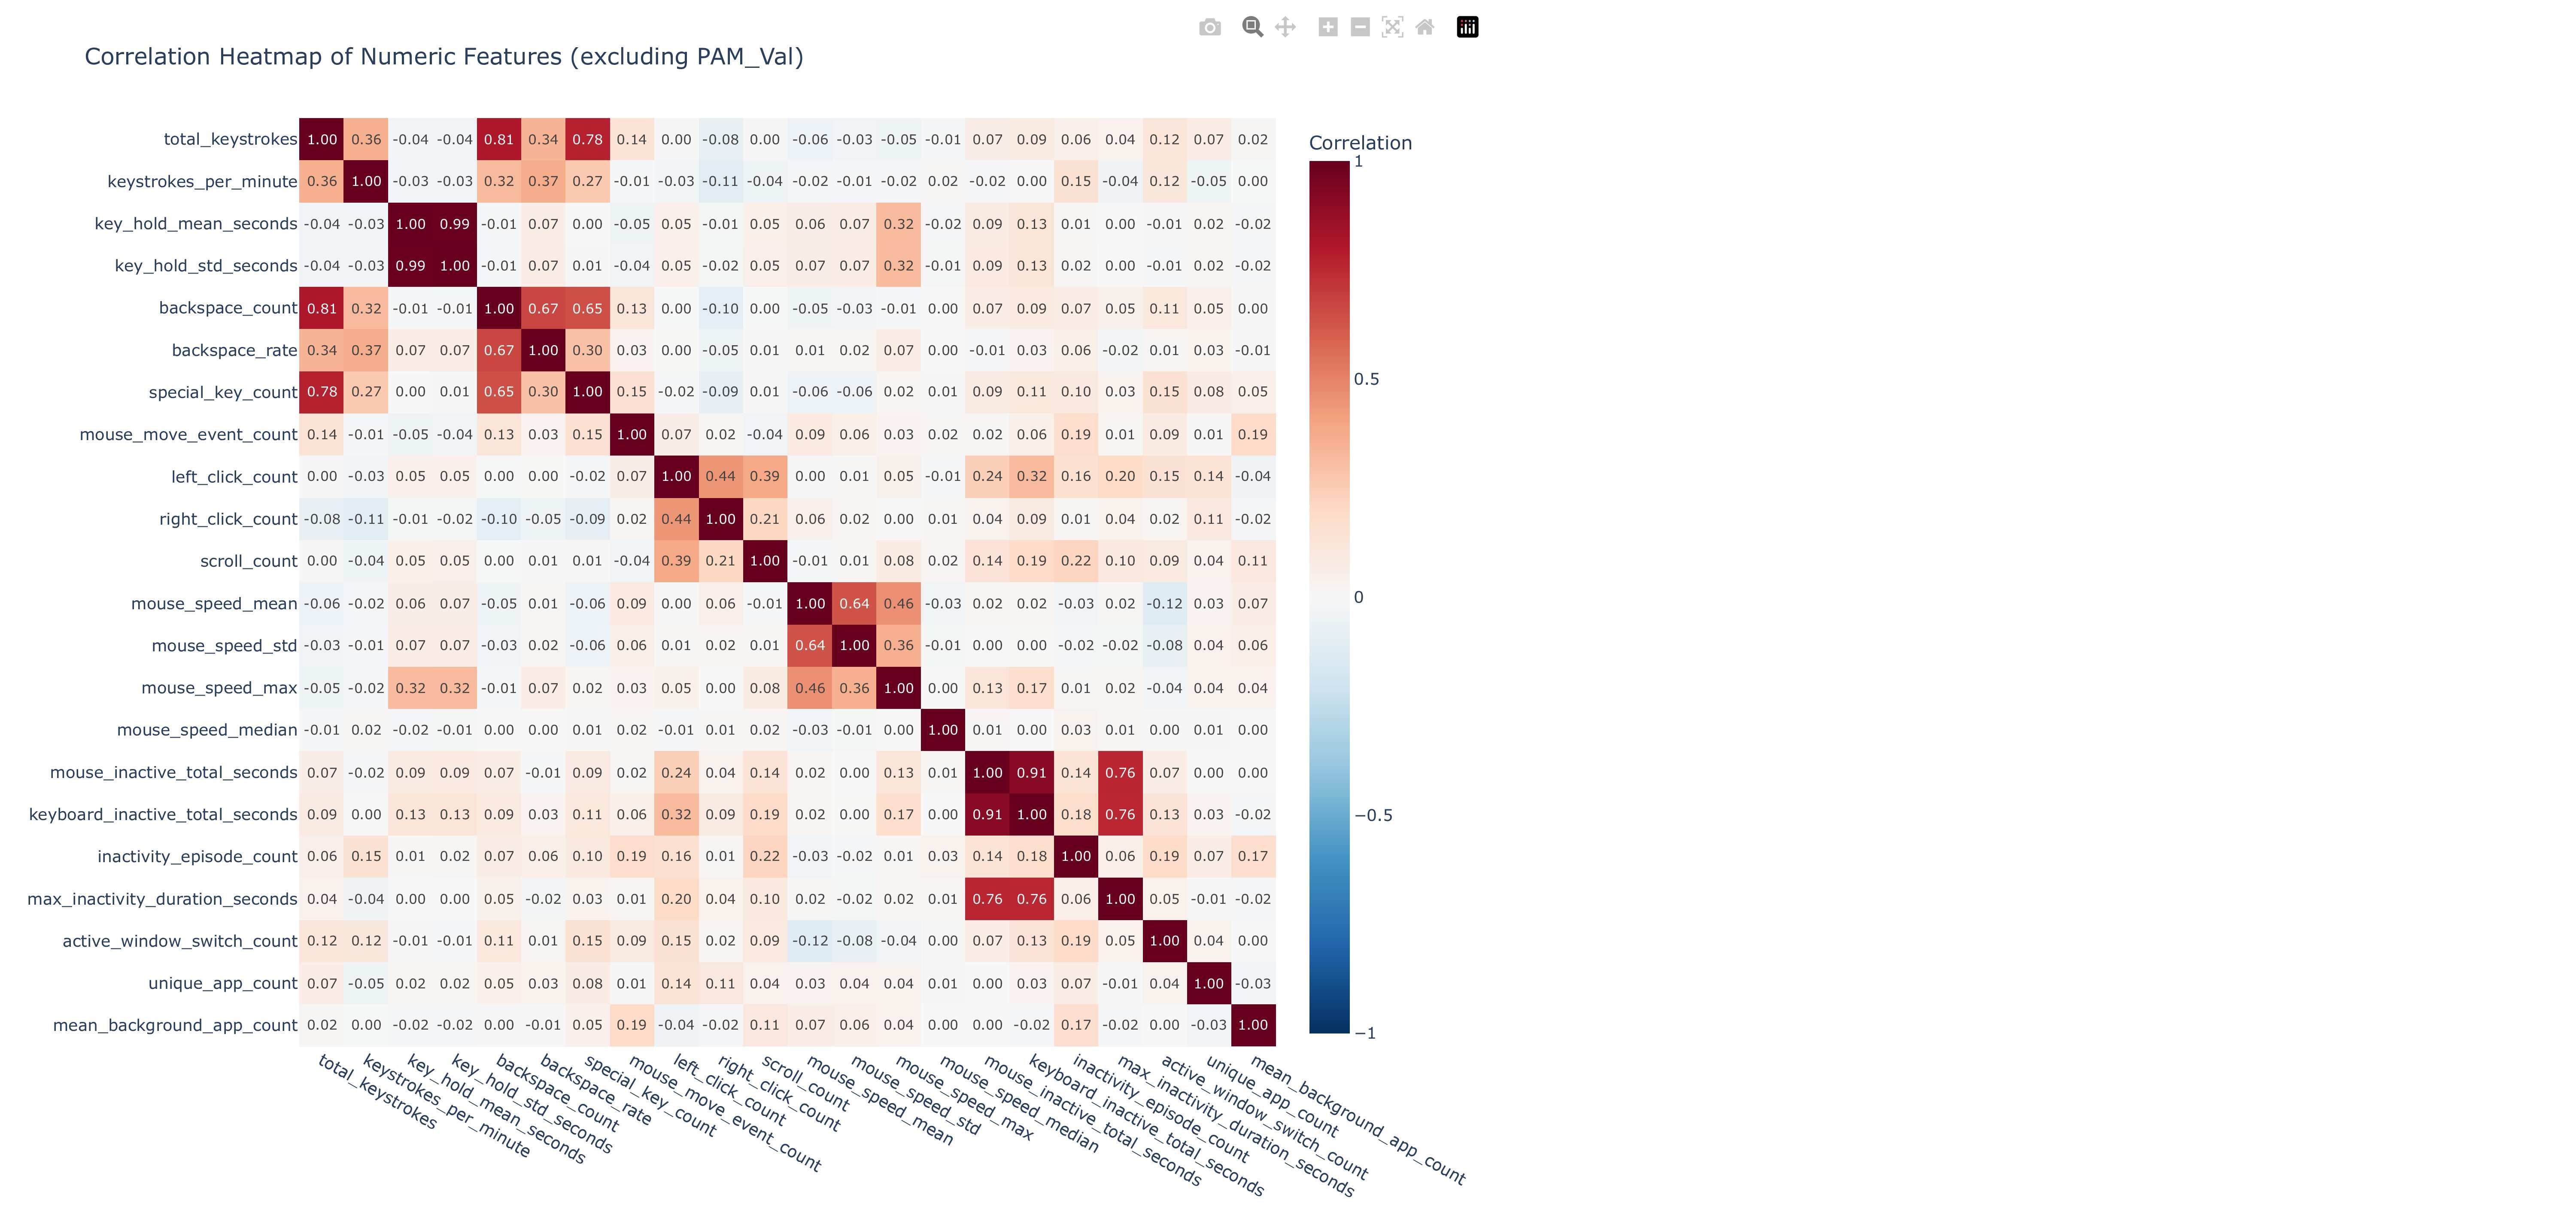
Keyboard: total keystrokes, key hold duration, backspace rate, special key count
Mouse: movement count, click counts, scroll count, speed statistics
Inactivity: total inactive seconds, episode count, max duration
App Usage: window switches, unique apps, background app count
This produced a clean 2,098 row feature table ready for machine learning — compressing gigabytes of raw data into a compact, analyzable format.
Problems Encountered & Corrections Made
A critical part of this evaluation was identifying where Terno AI failed and correcting it. Three major issues were caught and documented:
Problem 1 — Incorrect Plot Ordering
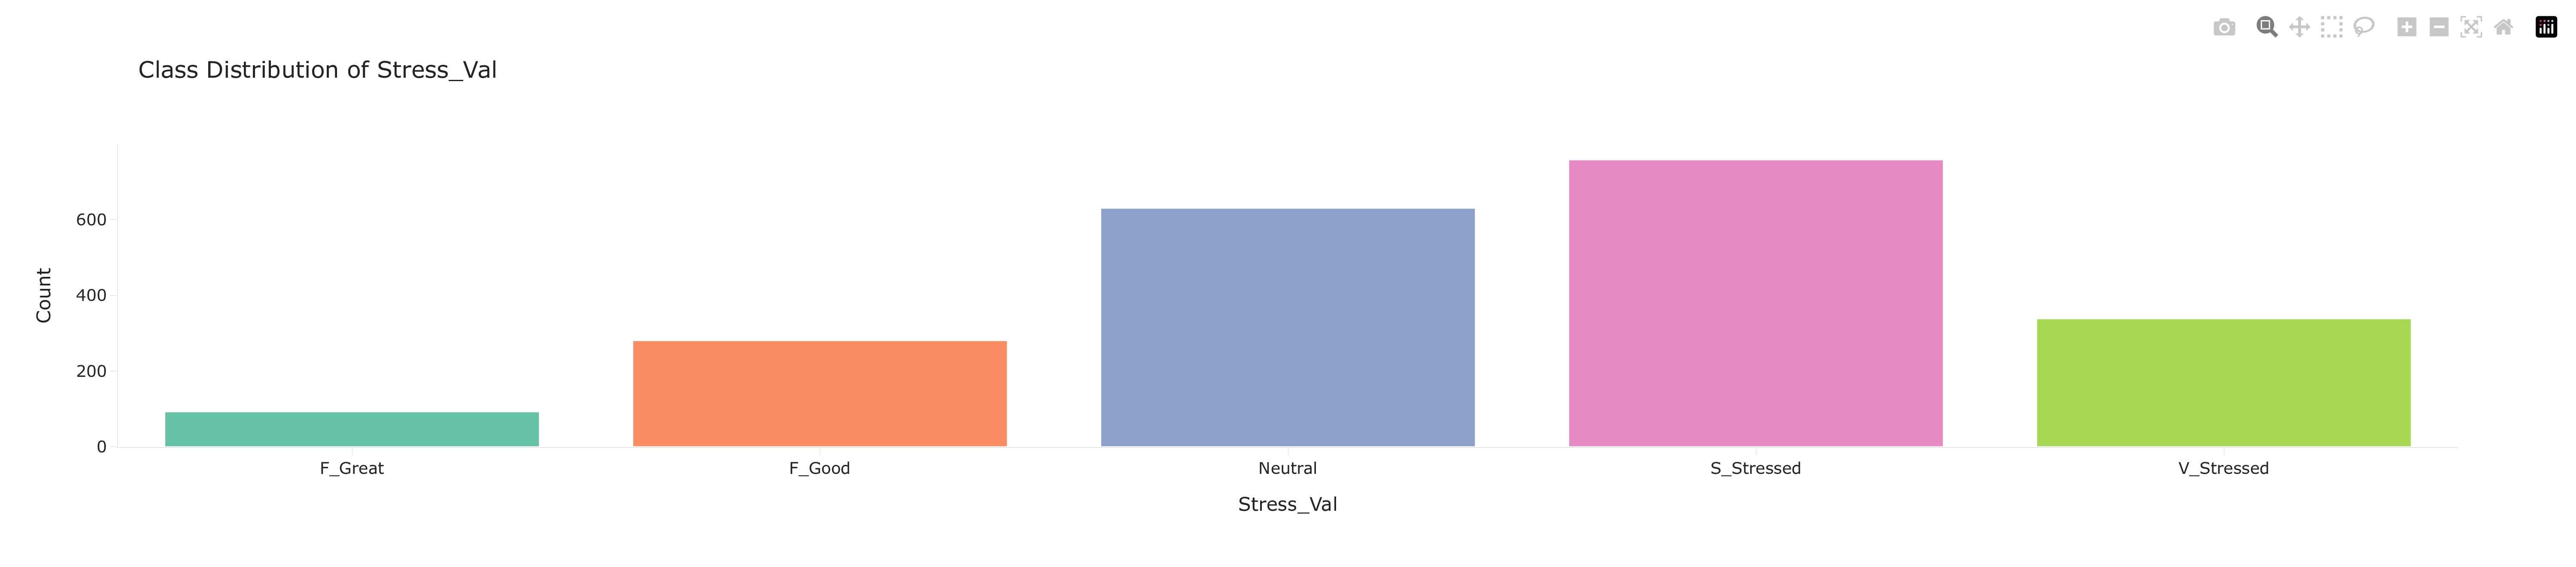
The initial stress distribution plot sorted classes by frequency rather than logical ordinal order. Stress levels carry meaning — F_Great to V_Stressed represents a spectrum. The plot was corrected to reflect this order.
Problem 2 — Data Leakage (Critical)
Terno AI included PAM_Val, Fatigue_Val, Energy_Val, and Pleasant_Val as input features. These are self-reported label columns — not behavioral signals. Using them to predict Stress_Val is data leakage, artificially inflating accuracy from ~55% to over 60%. All four columns were immediately removed from the feature set and the models were retrained from scratch.
Problem 3 — XGBoost Crash Due to Rare Classes
F_Great and F_Good had too few samples to survive 5-fold cross validation splits. XGBoost returned NaN accuracy. These classes were dropped and modeling was restricted to Neutral, S_Stressed, and V_Stressed — giving a clean 1,726 row modeling dataset.
These corrections are not failures — they are exactly what a rigorous evaluation process should produce.
Results & Model Performance
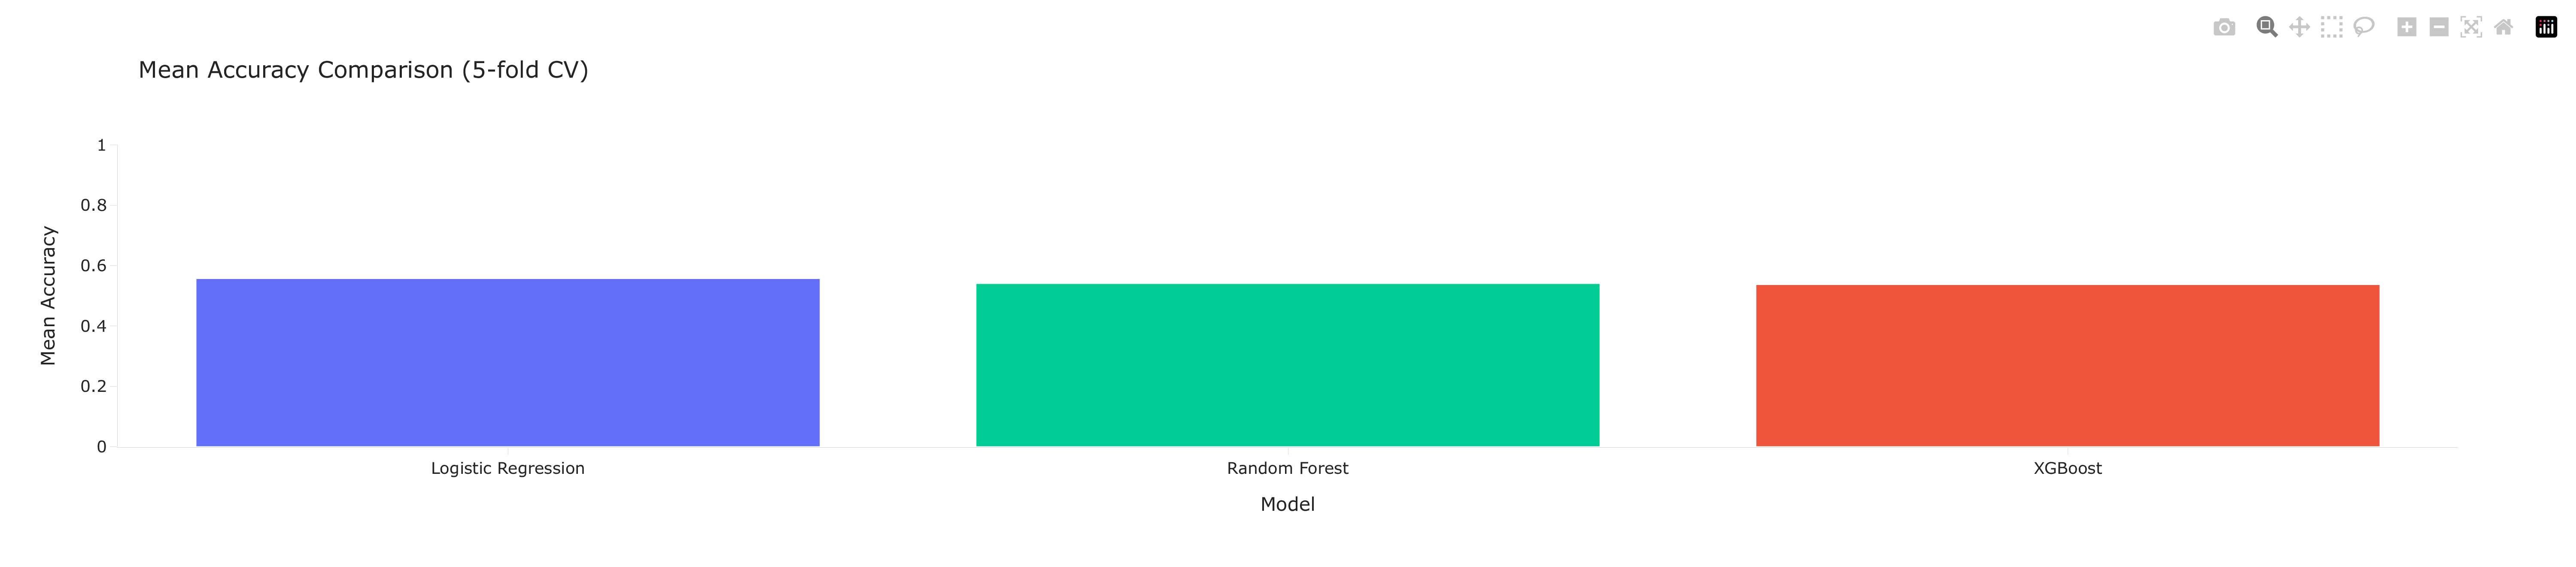
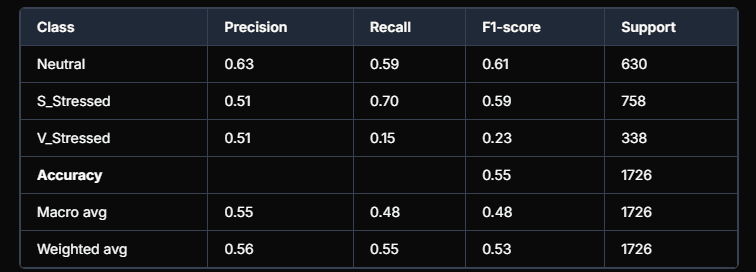
After cleaning, feature engineering, and correcting data leakage, three models were evaluated using 5-fold stratified cross-validation on 1,726 samples across three stress classes.
| Model | Mean CV Accuracy |
|---|---|
| Logistic Regression | 55.67% |
| Random Forest | 54.05% |
| XGBoost | 53.70% |
Logistic Regression performed best — surprising given its simplicity, but explainable. With moderate sample size and relatively linear decision boundaries between stress classes, a simpler model generalizes better than complex ensemble methods.
Key findings from the confusion matrix:
S_Stressed was predicted most reliably (highest recall)
V_Stressed was the weakest class — recall of only 0.15
Model frequently confused V_Stressed with S_Stressed — behavioral signals between these two classes are subtle and overlapping
Most important features (Random Forest):
Mouse movement count and mouse speed were the strongest predictors — not keyboard features as initially assumed. This suggests mouse behavior is a more consistent stress indicator than typing patterns.
Why Is Accuracy Moderate — And Why That Is Okay
The models achieved approximately 55% accuracy on a 3-class problem where random chance baseline is 33%. This is meaningful but modest. Here is why — and why it is honest:
1. Only 2 Users
The entire dataset comes from 2 individuals. Stress manifests differently in every person. A model trained on 2 people cannot confidently generalize to the broader population. This is a fundamental data limitation, not a modeling failure.
2. Subjective Labels
Stress levels were self-reported. What one person calls "somewhat stressed" another might call "very stressed." This label noise directly impacts model performance — the ground truth itself is imperfect.
3. 30-Minute Windows May Be Too Broad
Stress is dynamic. A user could be calm for 25 minutes and suddenly stressed for 5 — but the entire window gets one label. Finer granularity would require more frequent self-reports.
4. Behavioral Signals Have Natural Overlap
Stressed and neutral users can exhibit similar typing and mouse patterns depending on the task. These signals are probabilistic indicators, not definitive markers.
The honest conclusion: 55% accuracy with purely passive behavioral signals, no wearables, and no self-reporting during inference is a genuinely promising result for a 2-user exploratory study. It validates the concept — not the production system.
Conclusion & Future Directions
This case study set out to answer one question: can passive computer behavior detect stress without asking the user anything? The answer, based on this exploratory study, is — partially yes.
Behavioral signals from keystrokes, mouse movements, application usage, and inactivity periods do carry measurable stress information. A Logistic Regression model trained purely on these signals achieved 55.67% accuracy across three stress classes — significantly above the 33% random baseline — without any self-reporting during inference.
Key Takeaways:
Mouse behavior is a stronger stress indicator than keyboard behavior
Data leakage is a real and dangerous problem in ML pipelines — caught and corrected here
Small datasets with subjective labels have fundamental accuracy ceilings
Model complexity does not always win — Logistic Regression outperformed Random Forest and XGBoost
What This Is Not:
This is not a production-ready stress detection system. With only 2 users and subjective labels, generalization claims must remain cautious.
Future Directions:
Collect data from 50+ users for meaningful generalization
Use SMOTE or data augmentation to handle class imbalance
Explore time series models — LSTM or temporal CNNs — with sufficient data
Binary classification (stressed vs not stressed) as a simpler, more reliable formulation
Combine behavioral signals with physiological data for stronger predictions
Final thought: The most valuable outcome of this case study is not the 55% accuracy — it is the rigorous evaluation process that caught errors, corrected leakage, and documented limitations honestly. That is what separates exploratory research from misleading results.

18 August 2026
The Honest Number Was 83%: Leakage, Abstention, and a Complaint Router You Can Actually Deploy
The same complaint-routing model scores 96.3% or 83.2% depending on which three columns you leave in the training data. The high number is the intake form being read back to you. This is what the leakage audit found before a single model was trained, why 83.2% is the honest figure, and how the same model — given permission to say "I don't know" — becomes deployable at 90.7% accuracy on 79.5% of traffic.

29 July 2026
EdgeGuard: AI-Driven Predictive Maintenance for Power Transformers
Power transformers are among the most critical assets in electrical distribution infrastructure. Their unexpected failure can result in power outages, safety hazards, equipment damage, expensive repairs, and long service interruptions. Traditional transformer maintenance practices often rely on periodic manual inspection, offline testing, or run-to-failure maintenance. These methods are expensive, slow, labor-intensive, and unable to detect rapidly developing faults in real time. EdgeGuard is an AI-driven, edge-computing predictive maintenance system designed to continuously monitor transformer health and forecast failures before catastrophic damage occurs. The system acts as a retrofittable “Digital Doctor” for distribution transformers by combining low-cost industrial sensors, an ESP32 microcontroller, local intelligence, machine learning-based risk prediction, autonomous relay control, and a real-time web dashboard. The proposed system monitors six major transformer health indicators: temperature, humidity, vibration, oil level, current, and voltage. These signals are normalized and processed through a Multi-Layer Perceptron neural network to classify transformer condition and estimate failure risk. If the predicted risk crosses a critical threshold of 80%, EdgeGuard automatically triggers a relay through GPIO 26 to isolate the transformer from the electrical network. The system also supports secure remote control, dashboard monitoring, API-key-based hardware authentication, JWT-based user access, WebSocket live updates, and automatic live-hardware detection. With an estimated deployment cost of approximately ₹3,850, EdgeGuard offers a low-cost alternative to conventional transformer monitoring systems. Its cloud-independent operation and edge-based decision-making make it especially useful for rural and semi-urban distribution grids where connectivity and maintenance resources are limited.

28 July 2026
ANALYZING TOXIC USER BEHAVIOR AND RISK PATTERNS IN ONLINE GAMING PLATFORMS
This study shows that behavioral data alone can't reliably predict gaming toxicity — but a risk-based model combining behavioral and engineered features does a much better job of flagging the small segment of high-risk users driving disproportionate harm.