
From Bean to Bar: Mapping the Global Cocoa Supply Chain with AI
Introduction
Chocolate is more than just a sweet treat — it’s the result of a complex global supply chain that connects farmers, traders, manufacturers, and consumers. For companies in this space, understanding where the best cocoa beans come from, how consumer tastes evolve, and where new opportunities lie can shape both product development and market strategy.
To explore this, we have used Terno AI to analyze the Flavors of Cacao dataset. The goal was simple: to map the global cocoa supply chain and highlight opportunities for chocolate companies, retailers, and even investors.[See the full Terno AI conversation here]
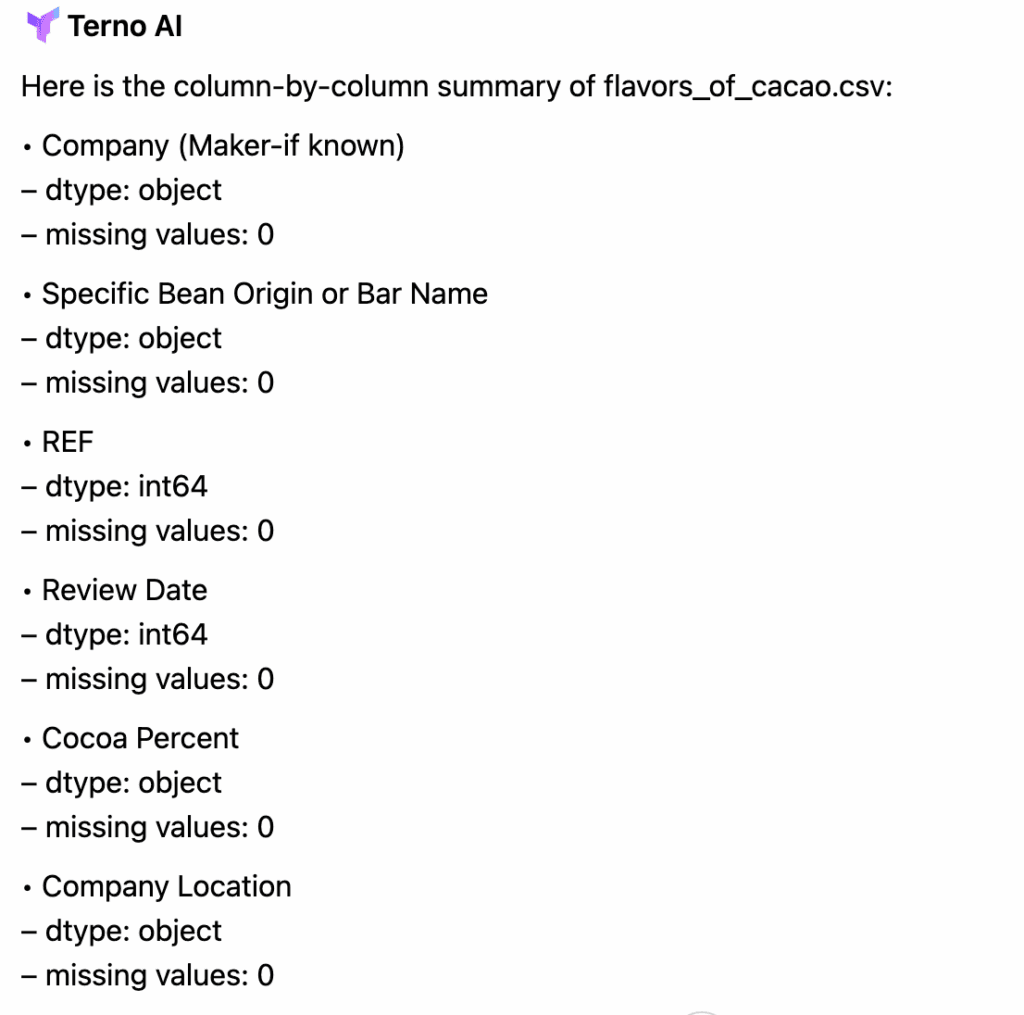
Prompt: Give me a summary of the dataset — what are the columns, data types, and missing values?
Where Do the Best Cocoa Beans Come From?
One of the first questions for any chocolate maker is: where should we source beans from to maximize quality and ratings?
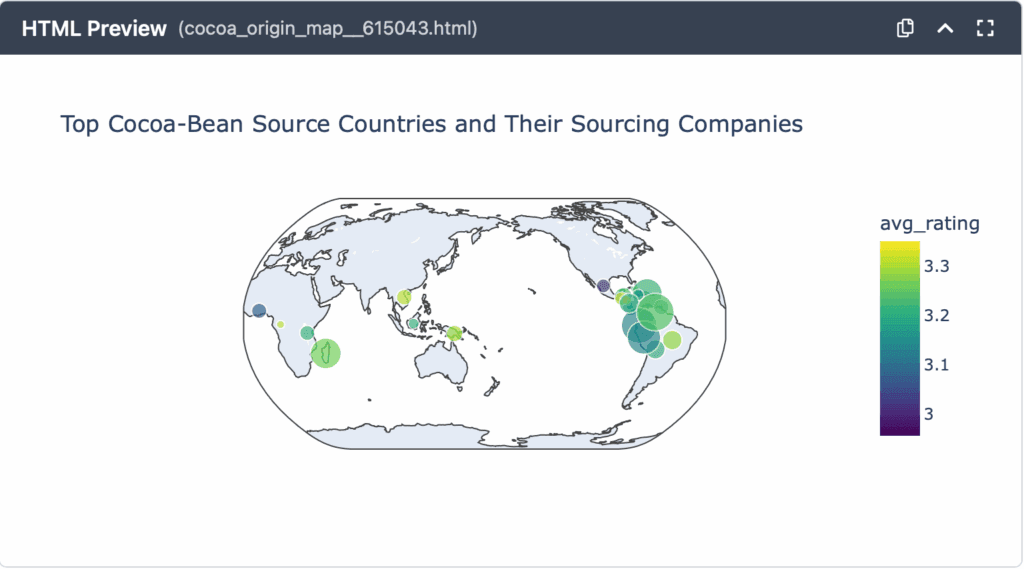
Terno AI helped create a world map showing top-rated cocoa bean origins and the companies sourcing them. This visualization highlights the regions that dominate the premium chocolate market.
**Prompt: **Create a world map of where the best cocoa beans come from and who is sourcing them.
How Tastes Have Changed Over Time
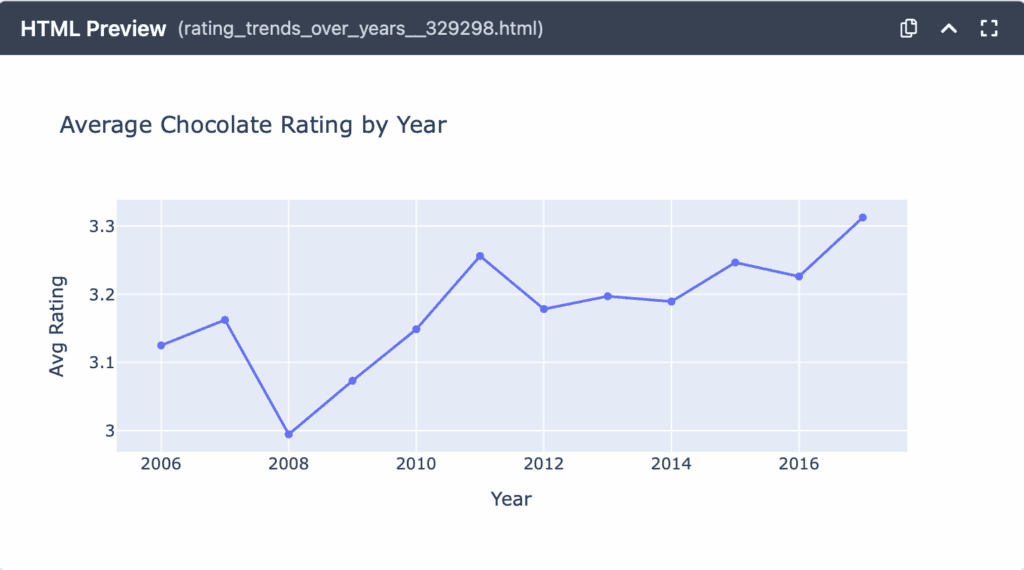
Consumer preferences are never static. Ratings over time reveal whether chocolates are improving and how certain regions are becoming more consistent in quality.
Here’s what Terno AI mapped out:
Rating trends over the years→ showing if global chocolate quality is rising.
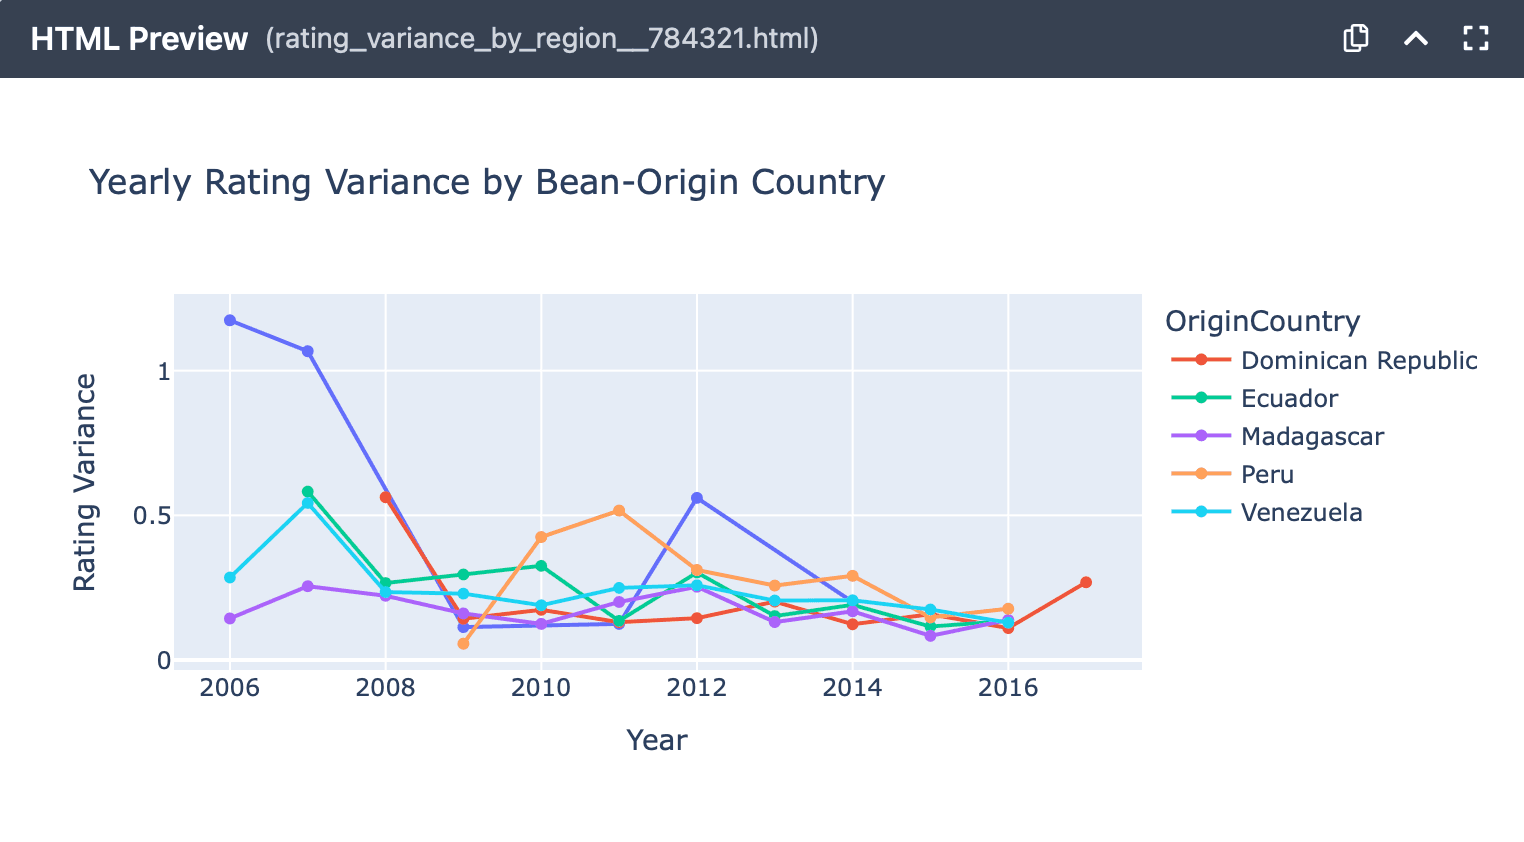
Variance in ratings by region→ highlighting which countries have stabilized in producing high-quality chocolate.
**Prompt: **Plot trends of chocolate ratings over the years.
**Prompt: **Plot the variance in ratings over time by region — are some countries becoming more consistent?

Emerging Cocoa Origins
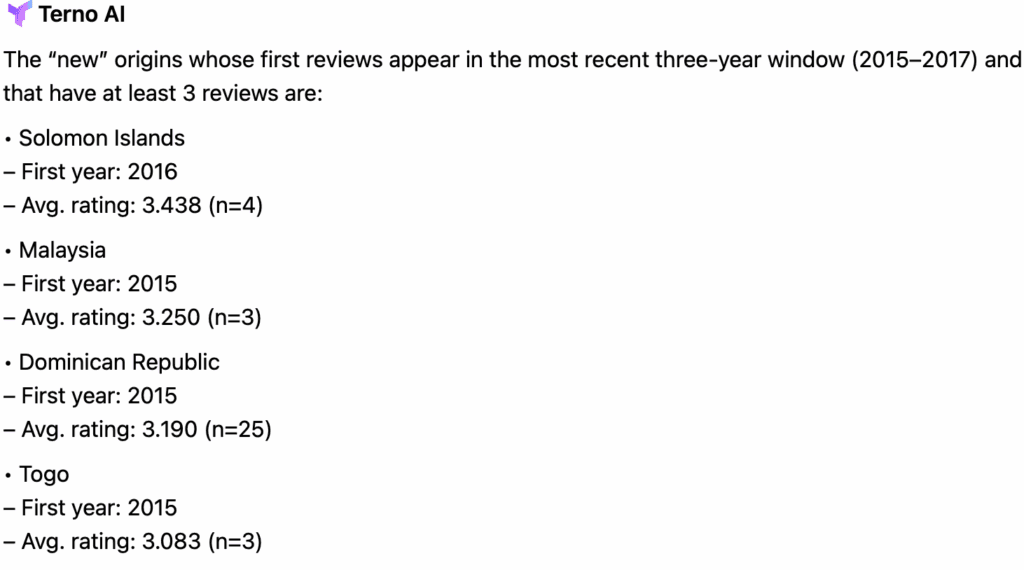
Beyond the traditional cocoa giants, new origins are entering the market with impressive ratings. These newcomers represent both a threat to established regions and an opportunity for forward-looking companies.
Key insight:
Newly entered origins with strong ratings.
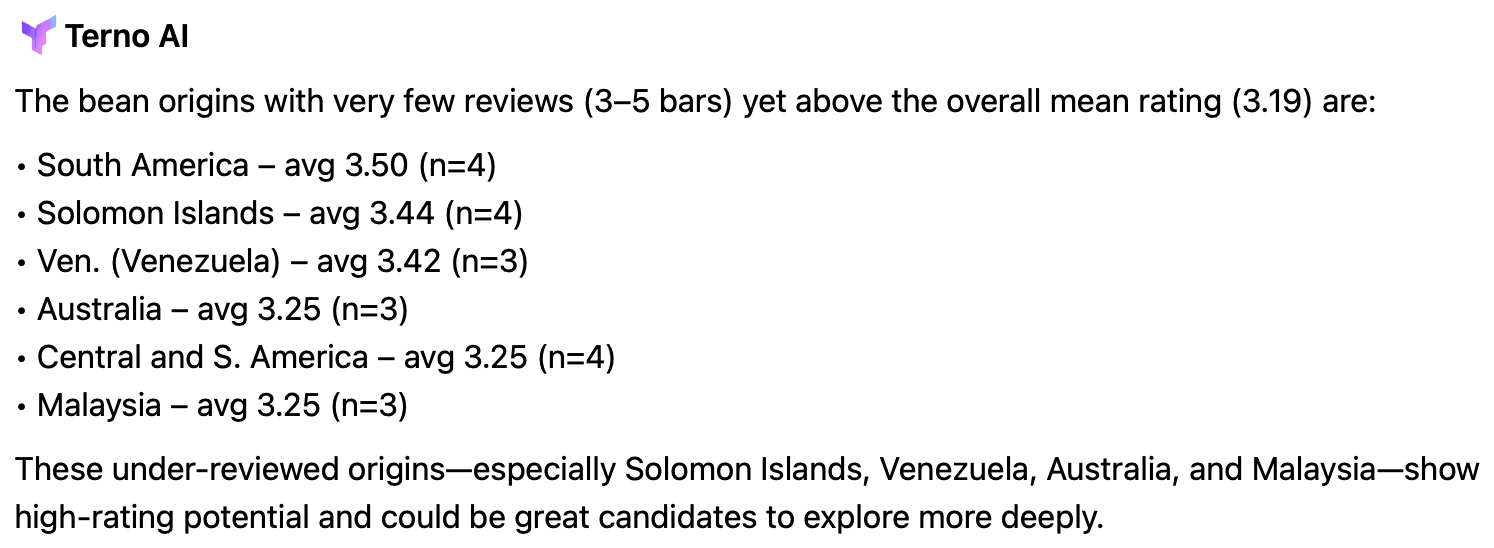
Underutilized bean origins that show potential but aren’t widely tapped yet.
**Prompt: **Which new bean origins have recently entered the market with good ratings?
Prompt: Which bean origins are underutilized but have potential for high ratings?
Mapping the Cocoa Trade Network
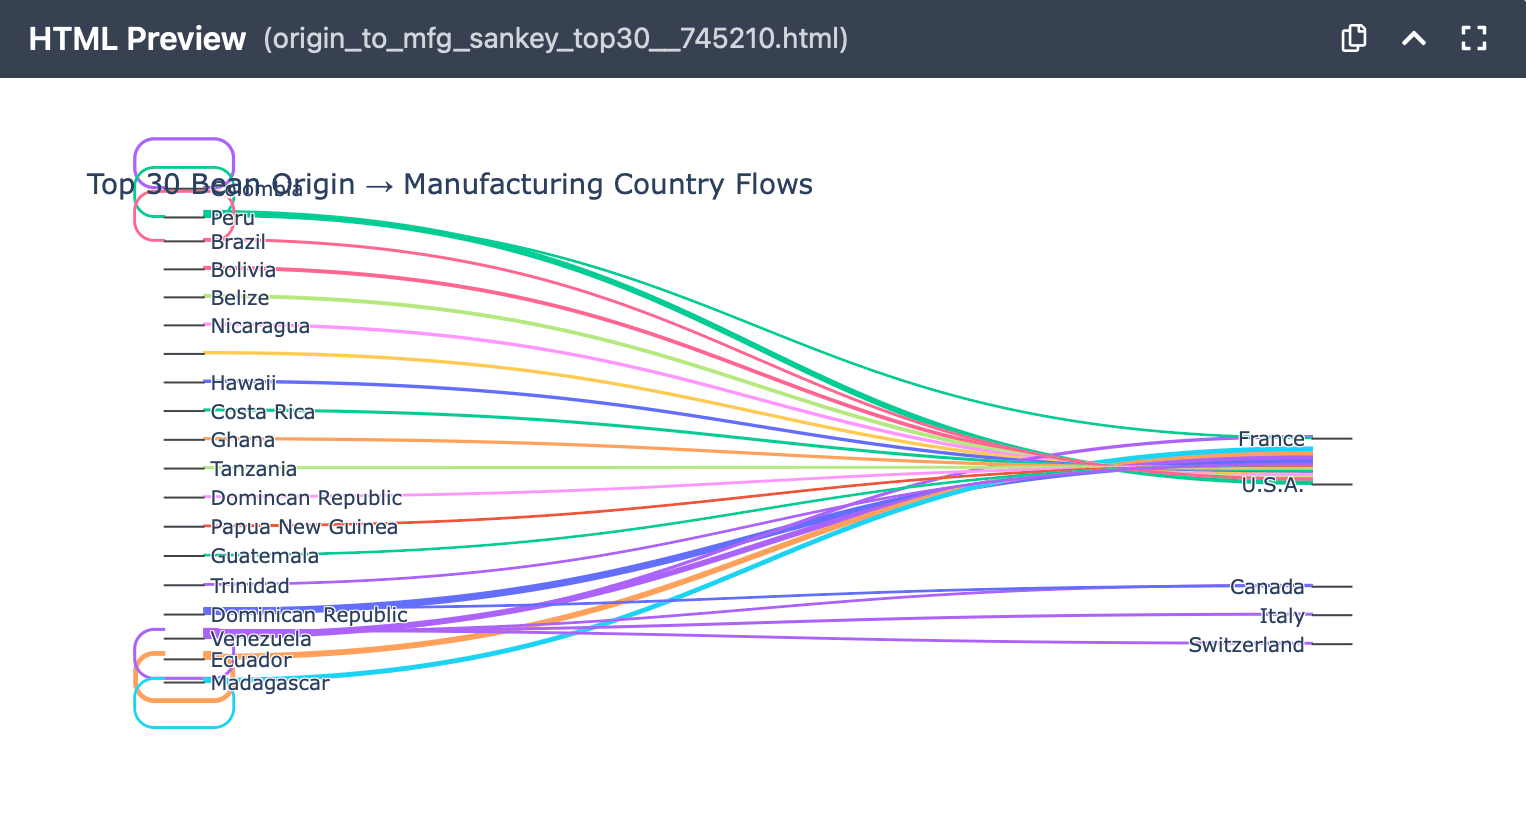
Chocolate is a global product: beans may be grown in South America, shipped to Europe, and transformed into premium bars in North America. To visualize these trade flows, we generated:
A Sankey Diagram of bean origin vs. manufacturing country → revealing global trade relationships.
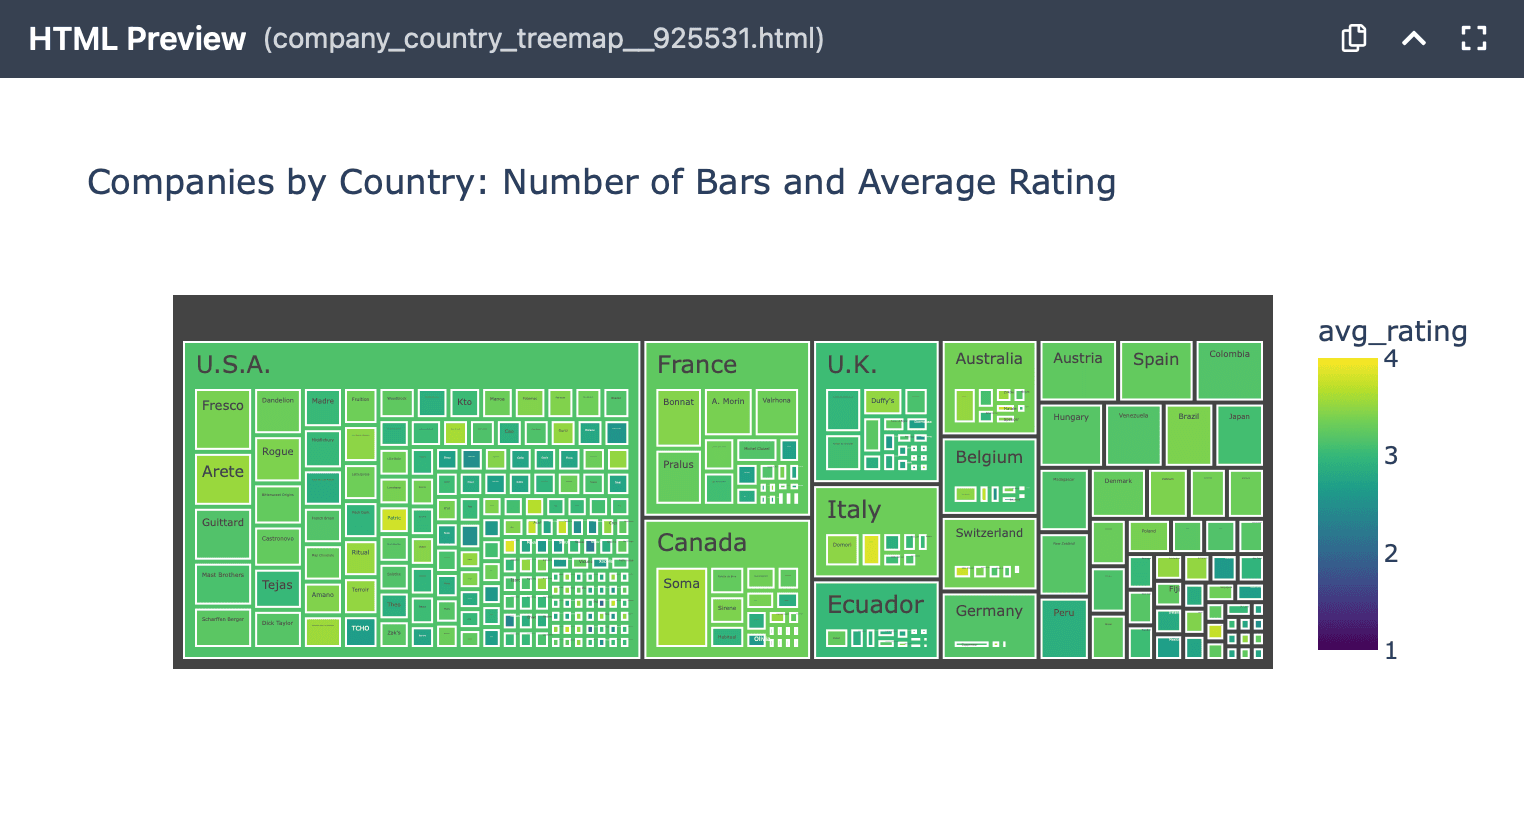
A Treemap grouping companies by country, sized by the number of bars and colored by rating.
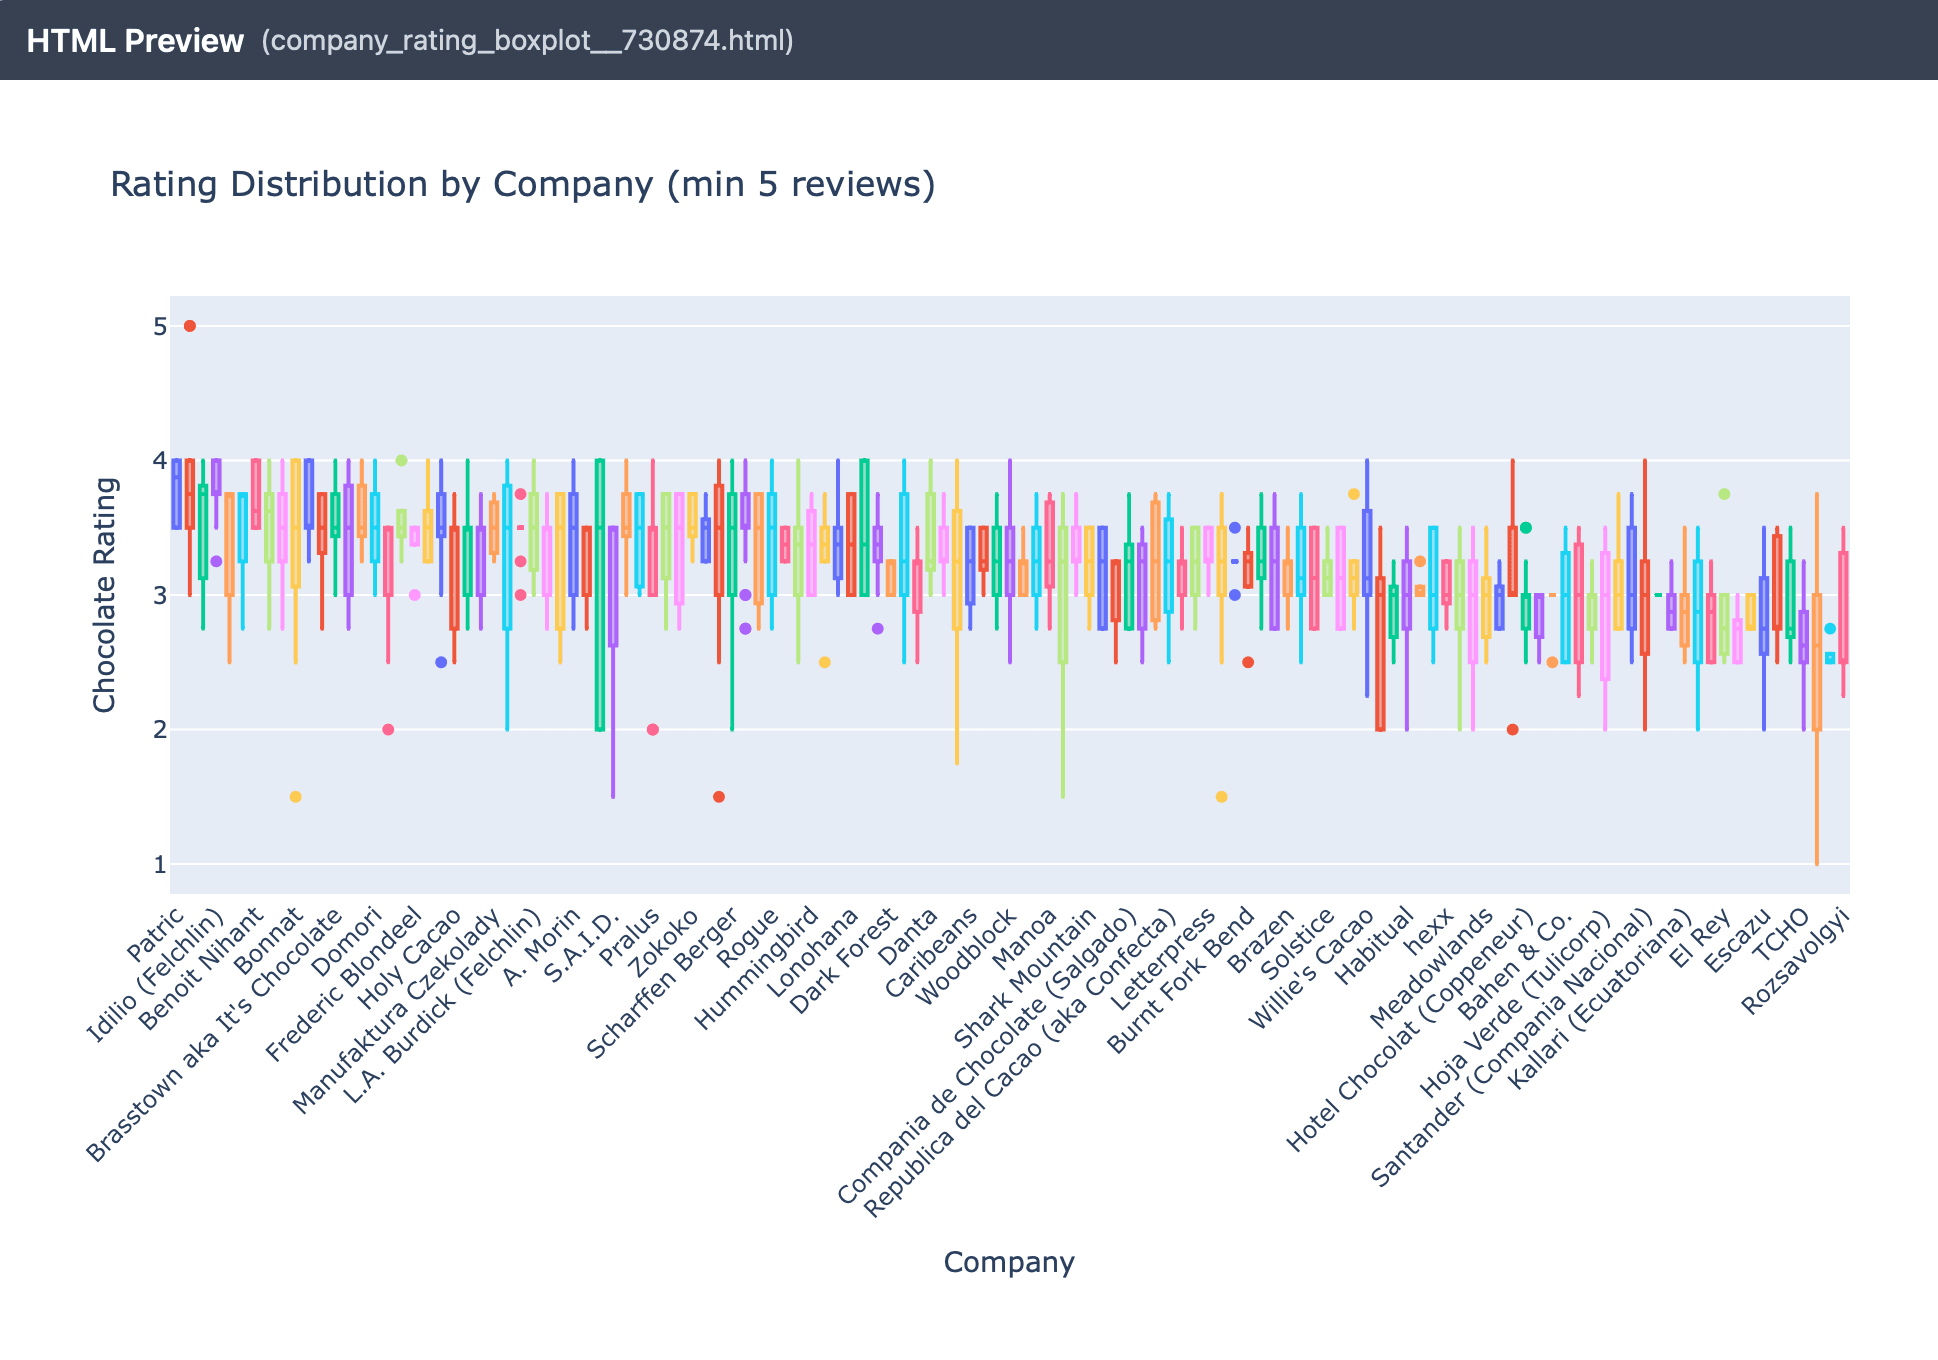
A Leaderboard (Boxplot) showing company rating distributions → which brands are consistent and which fluctuate.
Prompt: Take the top 30 bean origin vs. manufacturing country pairs and plot an interactive Plotly Sankey diagram.
Prompt: Create a treemap of companies grouped by country, sized by number of bars, colored by rating.
Prompt: Visualize a leaderboard of companies: plot company rating distribution (boxplot) rather than just averages.
Finding Market Gaps & Opportunities
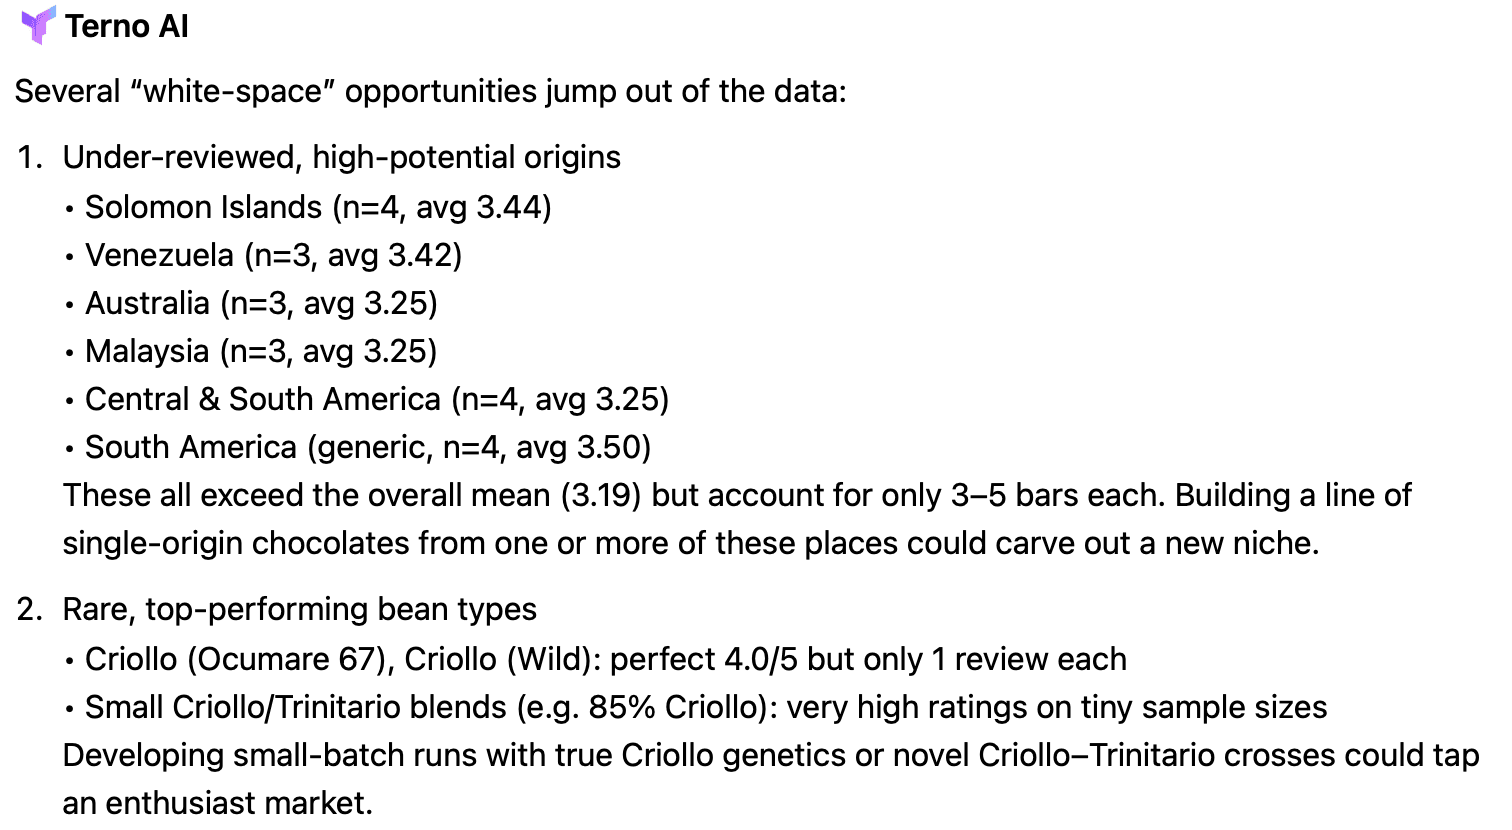
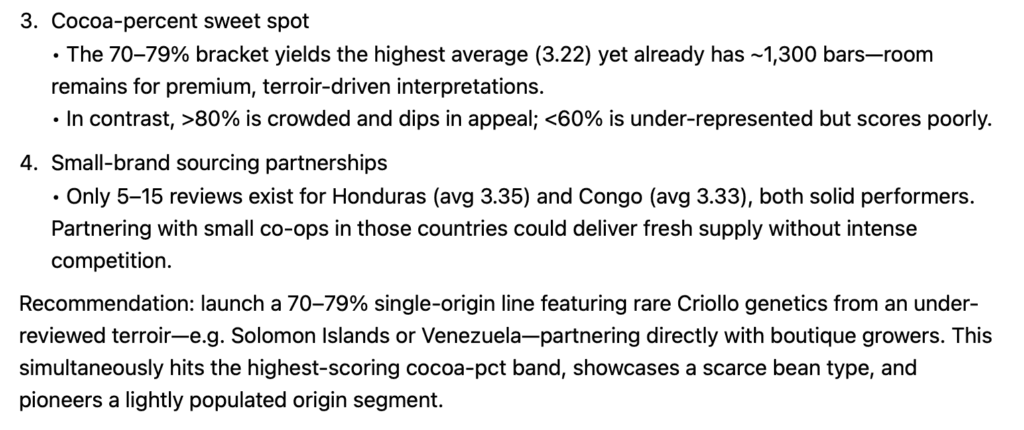
Not all opportunities are obvious. The below analysis highlighted market gaps where demand exists but supply is weak, or where high-potential origins are not being exploited. These insights could guide strategic sourcing decisions, new product lines, or entry into underdeveloped markets.
Prompt: What market gaps exist that can be targeted?
Summary: Insights for Strategy
Finally, we compiled a report that summarized the findings into actionable recommendations.
Key Findings:
Cocoa % Preference: 70–79% bars score highest (avg 3.22), while >80% underperform.
Top Origins & Bean Types: Honduras (3.35), Congo (3.33), Guatemala (3.32); Criollo‐dominant types lead when ≥10 reviews.
Leading Producers: Amedei (3.85), Patric (3.79), Idilio (Felchlin) (3.78), with tight rating consistency.
Rising & Under-utilized Origins: Solomon Islands, Venezuela, Australia, Malaysia show strong early ratings on few reviews—white-space opportunities.
Strategic Recommendations:
Product: Launch a 70–79% single-origin line—start with Honduran beans, then experiment with Solomon Islands or Venezuela.Positioning: Emphasize “single-origin,” artisanal quality, and Criollo/Trinitario heritage genetics.Supply Chain: Forge direct-trade partnerships in under-reviewed regions; diversify beyond crowded >80% cocoa segment.
Innovation: Offer limited‐edition batches of rare Criollo lines to command premium pricing and differentiate in the market..
Useful Links
Terno AI: https://terno.ai
**Dataset link: **flavors_of_cacao.csv
**Detailed analysis: **https://nikita.app.terno.ai/chat/share/b875f626-d6fd-4156-9552-10dffe523613

18 August 2026
The Honest Number Was 83%: Leakage, Abstention, and a Complaint Router You Can Actually Deploy
The same complaint-routing model scores 96.3% or 83.2% depending on which three columns you leave in the training data. The high number is the intake form being read back to you. This is what the leakage audit found before a single model was trained, why 83.2% is the honest figure, and how the same model — given permission to say "I don't know" — becomes deployable at 90.7% accuracy on 79.5% of traffic.

29 July 2026
EdgeGuard: AI-Driven Predictive Maintenance for Power Transformers
Power transformers are among the most critical assets in electrical distribution infrastructure. Their unexpected failure can result in power outages, safety hazards, equipment damage, expensive repairs, and long service interruptions. Traditional transformer maintenance practices often rely on periodic manual inspection, offline testing, or run-to-failure maintenance. These methods are expensive, slow, labor-intensive, and unable to detect rapidly developing faults in real time. EdgeGuard is an AI-driven, edge-computing predictive maintenance system designed to continuously monitor transformer health and forecast failures before catastrophic damage occurs. The system acts as a retrofittable “Digital Doctor” for distribution transformers by combining low-cost industrial sensors, an ESP32 microcontroller, local intelligence, machine learning-based risk prediction, autonomous relay control, and a real-time web dashboard. The proposed system monitors six major transformer health indicators: temperature, humidity, vibration, oil level, current, and voltage. These signals are normalized and processed through a Multi-Layer Perceptron neural network to classify transformer condition and estimate failure risk. If the predicted risk crosses a critical threshold of 80%, EdgeGuard automatically triggers a relay through GPIO 26 to isolate the transformer from the electrical network. The system also supports secure remote control, dashboard monitoring, API-key-based hardware authentication, JWT-based user access, WebSocket live updates, and automatic live-hardware detection. With an estimated deployment cost of approximately ₹3,850, EdgeGuard offers a low-cost alternative to conventional transformer monitoring systems. Its cloud-independent operation and edge-based decision-making make it especially useful for rural and semi-urban distribution grids where connectivity and maintenance resources are limited.

28 July 2026
ANALYZING TOXIC USER BEHAVIOR AND RISK PATTERNS IN ONLINE GAMING PLATFORMS
This study shows that behavioral data alone can't reliably predict gaming toxicity — but a risk-based model combining behavioral and engineered features does a much better job of flagging the small segment of high-risk users driving disproportionate harm.