Inventory Mistakes That Quietly Kill Profit
Introduction
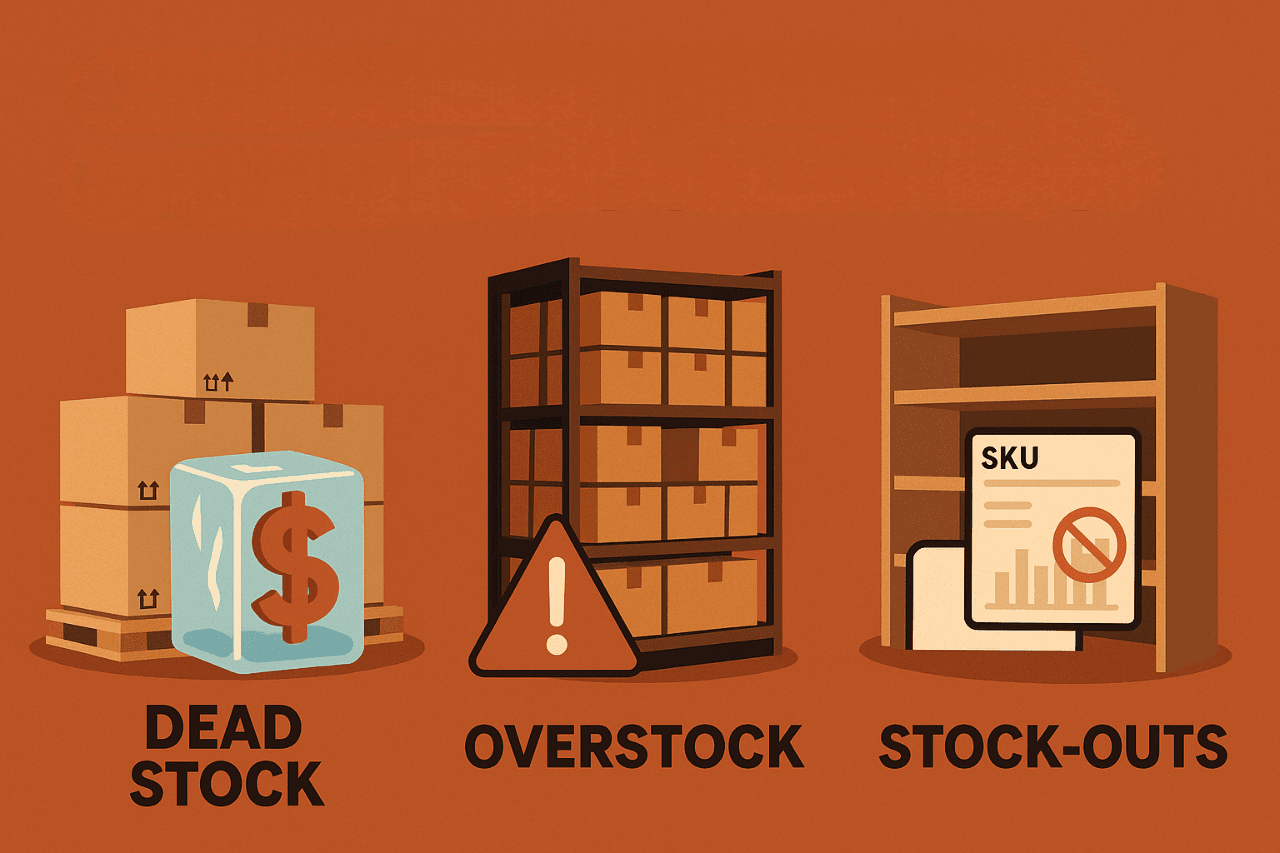
Your inventory could be costing you money without you even knowing it. Three common, "quiet" profit-killers are often hiding in your data:
Dead Stock: Products that don't sell, freezing your cash.
Overstock: Holding too much of a product, wasting capital and space.
Stock-Outs: Not having your bestsellers, leading to lost sales.
Finding these problems is hard, but fixing them is essential. We'll show you how to ask Terno AI a few simple questions to find and fix these drains, turning your inventory into a profit driver. [See the full Terno AI conversation here]
A Few Key Terms to Know
Before we start, here are a few simple definitions for terms we'll be using:
SKU (Stock Keeping Unit): This is just a unique code for each product. Think of it as a product's ID number (e.g., 1009AA or 3084CA).
ABC Analysis: A way to classify your products.
A-Class: Your "superstars"—the small group of products that make up most of your revenue (e.g., top 20% of items creating 80% of sales).
B-Class: Your "average" performers.
C-Class: Your "slow movers"—the large group of products that don't sell often or contribute much revenue.
Reorder Point: A simple signal. It's the minimum stock level a product should reach before you must place a new order to avoid running out.
*Step 1: See the Big Picture. Where is Your Money, Really?*
Before you hunt for problems, you need a map. Not all products are created equal. Some are your superstars (‘A-Class'), and some are just taking up space (‘C-Class'). The first mistake is treating them all the same.
We started by asking Terno AI to separate the high-performers from the rest and show us the financial picture.
**Prompt: **Visualize the total Inventory Value vs. total Revenue for each ABC Class.

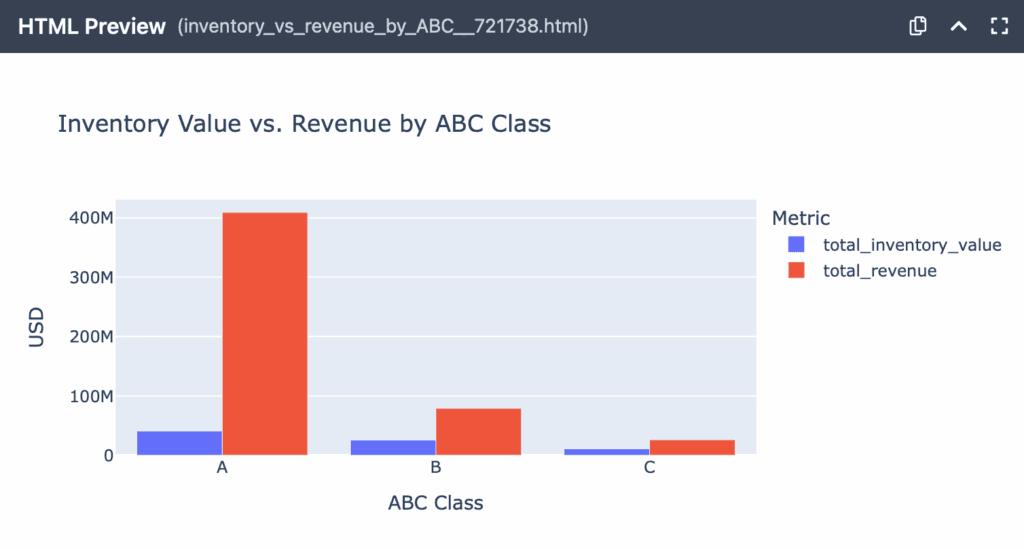
Insight: This chart is the first major health check for your business. What you want to see is your ‘A-Class' (your superstars) having high revenue and a proportional, controlled inventory value. What you don't want to see (and what's common) is the ‘C-Class' (your worst sellers) having a massive, tall ‘Inventory Value' bar. That's a classic sign of wasted capital—your money is stuck in products that aren't working for you.
To see it even more simply, we asked for a pie chart.
**Prompt: **Create a pie chart showing the distribution of total inventory value by ‘A-Class', ‘B-Class', and ‘C-Class'.

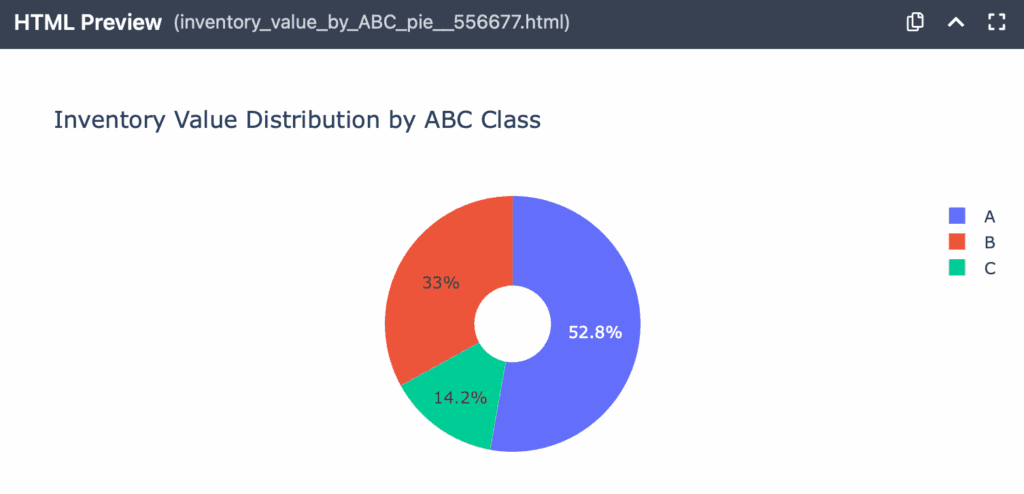
Insight: This pie chart simplifies the bar chart even further. It answers one question: "Where is my cash sitting?" If your ‘C-Class' takes up a 30% or 40% slice of the pie, that's a huge red flag. That's a massive chunk of your money that could be invested in your ‘A-Class' products to grow your sales.
Step 2: Find the "Dead Stock" Drain
Now we hunt for the first killer: dead stock. This isn't just inventory; it's a financial graveyard. It's cash you spent months or years ago that is now doing nothing but costing you storage fees.
**Prompt: **Calculate the total value of ‘dead stock', defining it as products with no sales in the 6 months prior to the last order date found in the dataset.


Insight: This isn't just a number; it's a recoverable asset. Think of this $41,250 as cash that has been frozen. Your job is to thaw it. You can run a clearance sale, bundle it with bestsellers, or even try to return it to your supplier. Every dollar you recover from this pile is pure, bottom-line profit that was previously lost.
Step 3: Uncover the "Overstock" Trap
Overstock is different from dead stock. These products still sell, just very slowly. The mistake is holding a 2-year supply of something when you only need a 3-month supply. That's cash that could be used to buy more of your bestsellers.
**Prompt: **Create a treemap visualizing the ‘Inventory Value' of the top 20 most overstocked SKUs. The size of each rectangle should be its value.

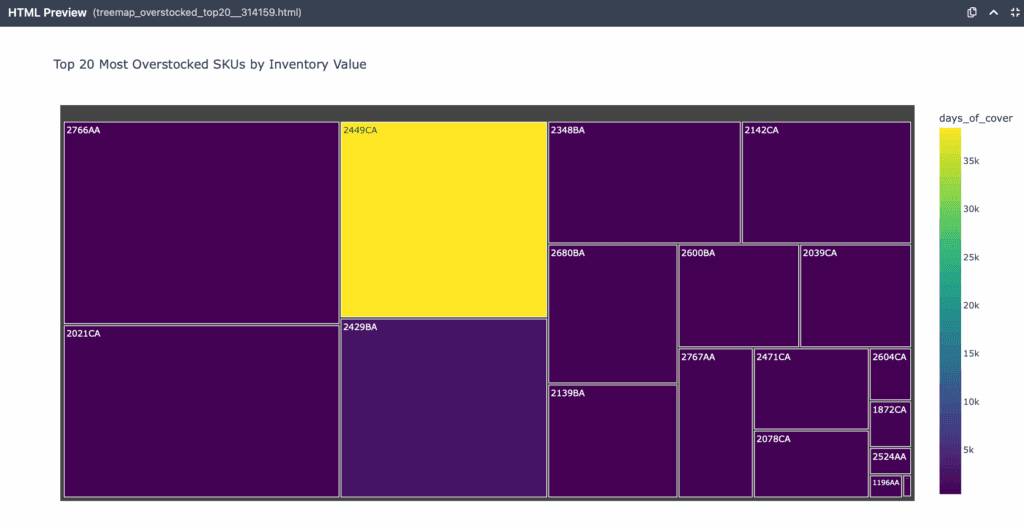
Insight: A long list of 20 products is just more data. This treemap turns that data into an action plan. Your eyes are immediately drawn to the biggest rectangles. These are your top 3-5 ‘cash drains'. Instead of a scattered effort, you can now focus all your energy on solving just those few items—perhaps by stopping future orders or running a targeted promotion. It's about surgical, focused action.
Step 4: Stop the Bleeding from "Stock-Outs"
This is the most painful mistake: a customer wants to give you money for your A-Class, high-profit item, but you don't have it. You've not only lost a sale; you may have lost a customer.
**Prompt: **Show the top 10 ‘A-Class' (high-value) products that are at the highest risk of stocking out.

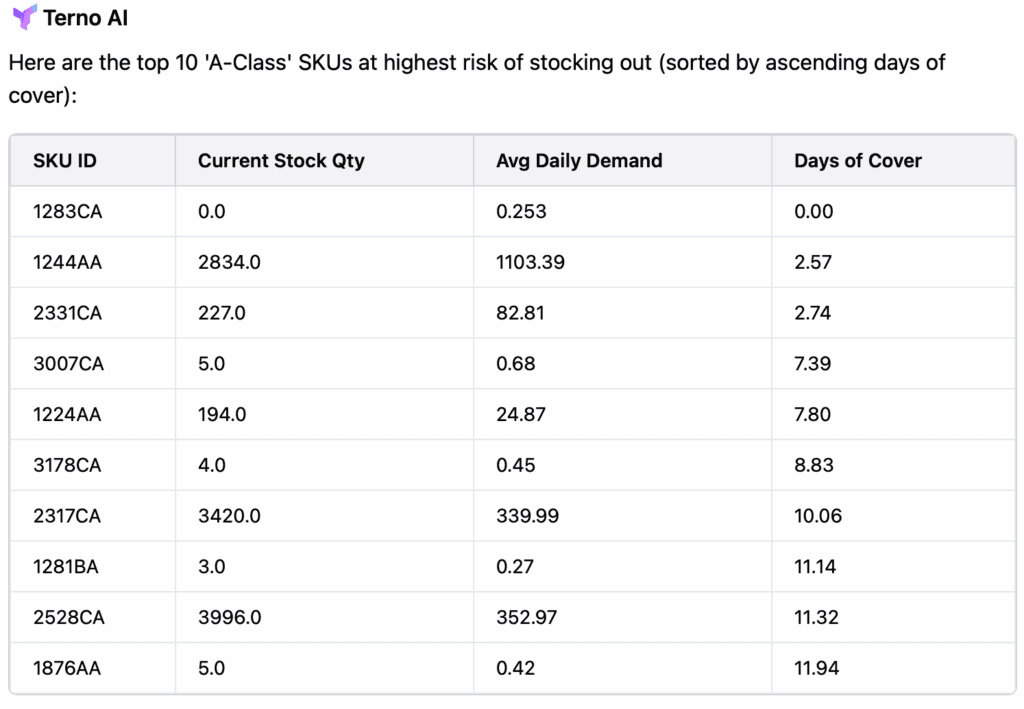
Insight: This list is your ‘highest priority' to-do list. These are your most valuable products that customers want to buy right now, but they're about to disappear from your shelves. Every day you are out of stock on one of these items, you are not only losing a sale but also disappointing a loyal customer who might go to a competitor.
This is good. But a list of SKU IDs isn't a business case. We need to know the financial impact of this risk.
Prompt:
What is the total inventory value of all ‘A-Class' products currently stocked below their ‘Reorder Point'?


Insight: This is the ‘Why' that justifies immediate action. This $14.8M is the value of your revenue pipeline that is at risk. When you need to get a purchase order approved, this is the number you use. It's not a vague "we need to buy more stock" request; it's a "we need to protect $14.8 million in critical, high-revenue assets" business case.
Step 5: Get Your Action Plan
Data is useless without a decision. After this audit, you can ask Terno AI for the one thing that matters most.
**Prompt: **Summarize the top 3 most critical actions I should take to increase profit, based on this entire analysis.

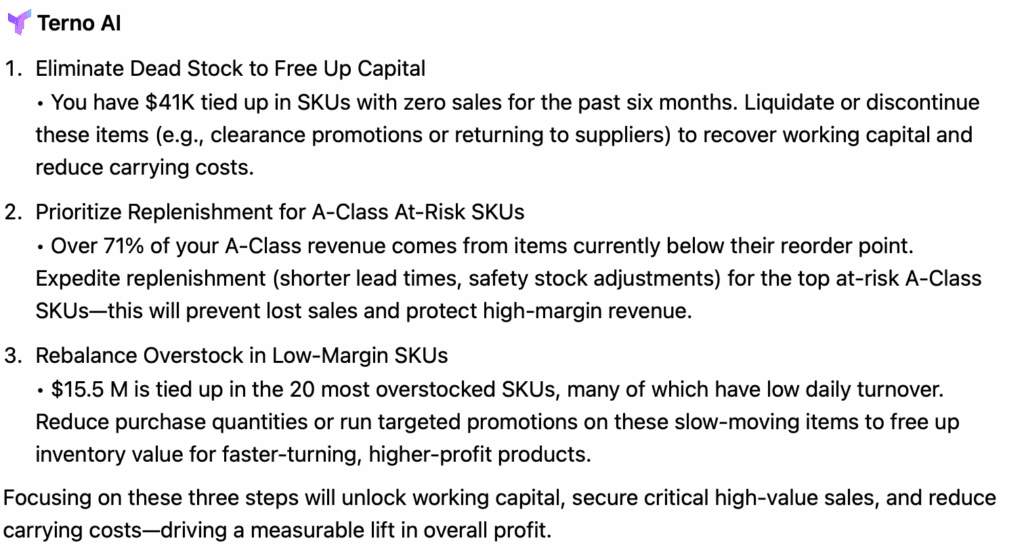
This is the final, crucial step. The analysis has moved you from being reactive (just handling day-to-day orders) to being proactive (a strategic manager). You now have a clear plan that directly links your inventory data to your company's profitability. You can act on these three points this week to make a measurable difference.
Useful Links
Terno AI: https://terno.ai
**Dataset link: **https://www.kaggle.com/datasets/fayez1/inventory-management
**Detailed analysis: **https://nikita.app.terno.ai/chat/share/26da83ed-a9b8-43da-9311-e1609f0e4e0c

18 August 2026
The Honest Number Was 83%: Leakage, Abstention, and a Complaint Router You Can Actually Deploy
The same complaint-routing model scores 96.3% or 83.2% depending on which three columns you leave in the training data. The high number is the intake form being read back to you. This is what the leakage audit found before a single model was trained, why 83.2% is the honest figure, and how the same model — given permission to say "I don't know" — becomes deployable at 90.7% accuracy on 79.5% of traffic.

29 July 2026
EdgeGuard: AI-Driven Predictive Maintenance for Power Transformers
Power transformers are among the most critical assets in electrical distribution infrastructure. Their unexpected failure can result in power outages, safety hazards, equipment damage, expensive repairs, and long service interruptions. Traditional transformer maintenance practices often rely on periodic manual inspection, offline testing, or run-to-failure maintenance. These methods are expensive, slow, labor-intensive, and unable to detect rapidly developing faults in real time. EdgeGuard is an AI-driven, edge-computing predictive maintenance system designed to continuously monitor transformer health and forecast failures before catastrophic damage occurs. The system acts as a retrofittable “Digital Doctor” for distribution transformers by combining low-cost industrial sensors, an ESP32 microcontroller, local intelligence, machine learning-based risk prediction, autonomous relay control, and a real-time web dashboard. The proposed system monitors six major transformer health indicators: temperature, humidity, vibration, oil level, current, and voltage. These signals are normalized and processed through a Multi-Layer Perceptron neural network to classify transformer condition and estimate failure risk. If the predicted risk crosses a critical threshold of 80%, EdgeGuard automatically triggers a relay through GPIO 26 to isolate the transformer from the electrical network. The system also supports secure remote control, dashboard monitoring, API-key-based hardware authentication, JWT-based user access, WebSocket live updates, and automatic live-hardware detection. With an estimated deployment cost of approximately ₹3,850, EdgeGuard offers a low-cost alternative to conventional transformer monitoring systems. Its cloud-independent operation and edge-based decision-making make it especially useful for rural and semi-urban distribution grids where connectivity and maintenance resources are limited.

28 July 2026
ANALYZING TOXIC USER BEHAVIOR AND RISK PATTERNS IN ONLINE GAMING PLATFORMS
This study shows that behavioral data alone can't reliably predict gaming toxicity — but a risk-based model combining behavioral and engineered features does a much better job of flagging the small segment of high-risk users driving disproportionate harm.