
A data-driven framework to forecast hazardous conditions and enhance safety decision-making for last-mile delivery workers, using the Terno Agentic AI Platform.
Abstract
This study presents a comprehensive, data-driven framework to assess and predict delivery agent risk across urban environments in India. By integrating multiple datasets — including food delivery operations, customer behavior, weather conditions, and road safety data — the research identifies key factors influencing risk, such as traffic density, visibility, weather conditions, and accident severity.
Using machine learning models, including Random Forest and XGBoost, the study develops predictive systems capable of estimating risk scores at both city and scenario levels. Findings reveal that operational risks are not solely driven by delays, which remain relatively low even under adverse conditions, but are significantly influenced by environmental and infrastructural factors — particularly low visibility and high traffic density.
Spatial analysis highlights notable variations in risk across cities, emphasizing the role of urban planning and road infrastructure. The study also demonstrates how predictive models can be extended to new cities using scenario-based inputs, enabling scalable decision-making. Finally, the research explores practical applications for logistics businesses — market entry strategy, risk-aware routing, workforce safety improvements, and fraud detection — shifting the focus from speed optimization to safety-aware systems.
Disclaimer: This is a purely data science study based on publicly available datasets. Any relation found with the real world is unintentional and coincidental. The maker or evaluator of this report holds no responsibility.
1. Introduction
The rapid expansion of digital platforms and smartphone adoption has propelled India into becoming one of the fastest-growing gig economies in the world, with last-mile delivery emerging as a major segment of urban employment. But this convenience has come with critical safety, health, and operational challenges for delivery workers operating under precarious, high-pressure conditions.
Globally, research shows gig-economy delivery riders face heightened risks of traffic collisions, stress, fatigue, and exposure to adverse conditions — especially motorized two-wheeler riders who dominate urban deliveries (Useche et al., 2025). Gig workers frequently face time pressure, lack formal safety training, and work without organizational safeguards, increasing risky behaviors like speeding and traffic violations (Christie et al., 2019).
In India specifically, these risks are compounded by:
Congested city streets under extreme heat and heavy monsoon rains, without institutional support or protective gear (Gupta, 2025)
Lack of formal employee status — meaning many gig workers lack safety training, healthcare benefits, or insurance (Nishtha R., 2025)
Reported road accidents among delivery personnel in cities like Chennai, largely tied to overspeeding, distraction, and inadequate safety practices (TOI, 2026)
Regulatory scrutiny — e.g., Kochi's Motor Vehicles Department issuing notices to delivery firms over unsafe driving tied to tight timelines (TOI, 2025)
Social safety risks: harassment, theft, and violence against delivery agents reported across multiple cities (Wired, 2023)
Despite these risks, delivery platforms predominantly optimize for time and cost, overlooking multidimensional safety indicators like environmental hazards, spatial accident patterns, and crime risk. This project aims to fill that gap with a comprehensive, data-driven system that predicts spatiotemporal risk for delivery workers in Indian cities, delivering actionable insights — safe working windows, high-risk zones, route recommendations, and protective guidance.
Research Objectives
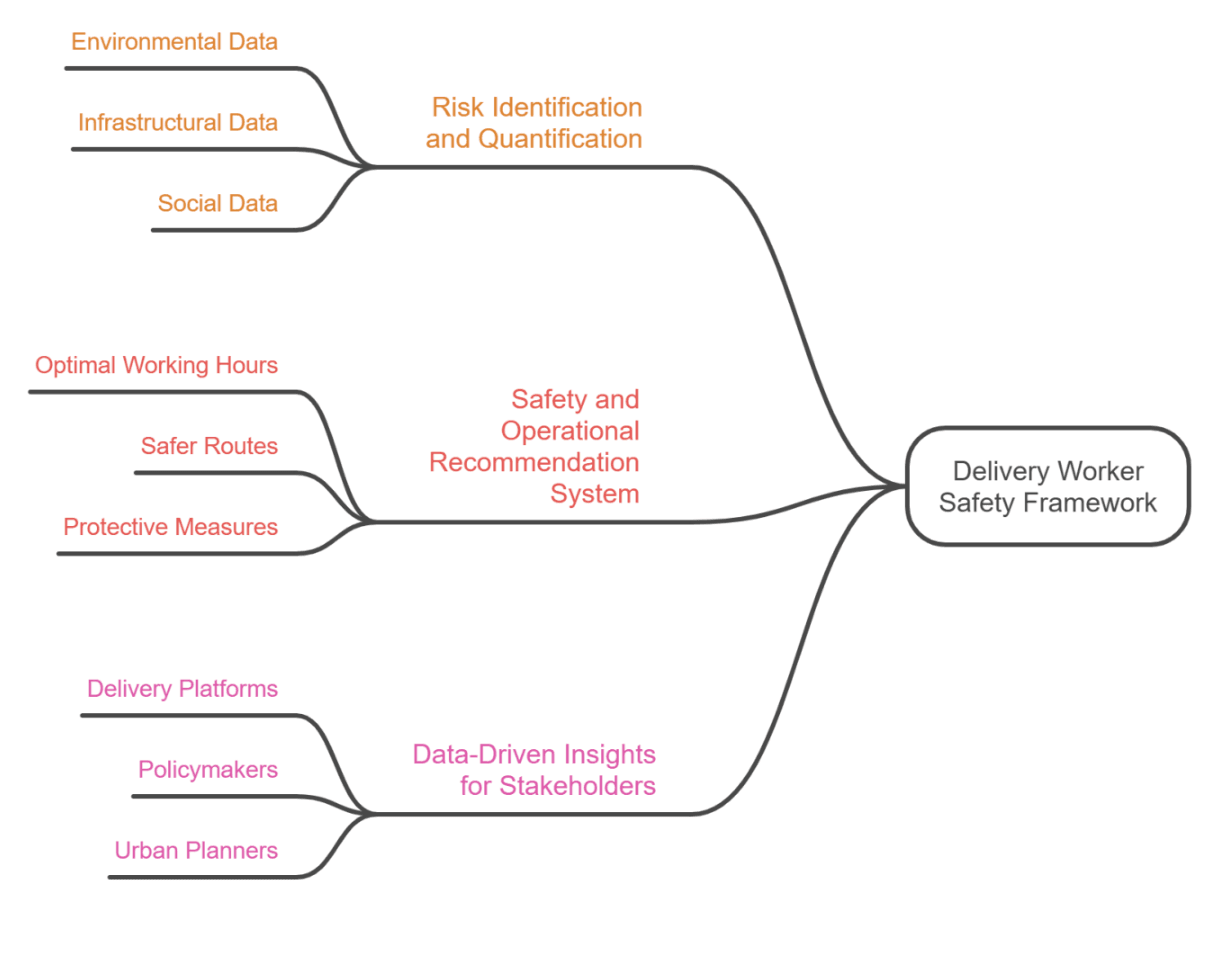
- Risk Identification and Quantification — Develop a framework that identifies and quantifies risks by integrating environmental (weather, pollution), infrastructural (traffic, accident data), and social (crime, worker reviews) datasets.
- Safety and Operational Recommendation System — Design a predictive model providing actionable recommendations: optimal working hours, safer routes, and protective measures.
- Data-Driven Insights for Stakeholders — Generate insights that inform delivery platforms, policymakers, and urban planners on high-risk areas and welfare strategies.
2. Datasets Used
The research integrates five primary datasets sourced from Kaggle, collectively covering delivery performance, rider and customer behavior, weather patterns, and delivery environment characteristics across India.
Table 1: Dataset descriptions
| Dataset | Contribution | Analytical Role |
|---|---|---|
| Delivery Time Prediction | Operational performance | Regression & Delay Modeling |
| Food Ordering Behavior | Temporal & demographic patterns | Demand & Peak Time Analysis |
| Delivery Agent Reviews | Worker perceptions | Sentiment & Qualitative Risk |
| India Weather Forecast | Environmental risk | Weather risk scoring |
| Food Delivery (Traffic & Route) | Route & traffic conditions | Infrastructure & route risk |
a. India Food Delivery Time Prediction Dataset (Source: Kaggle — changlechangsu/india-food-delivery-time-prediction)
Detailed delivery records with features like delivery time, location, order type, customer feedback, price range, discount application, service rating, and order accuracy. Serves as the core operational dataset, enabling regression modeling, clustering of delivery efficiency, and spatial comparison of delivery times across cities like Delhi, Lucknow, Chennai, and Ahmedabad.
b. Food Ordering Behavior India: 50k Orders (Source: Kaggle — rhythmghai/food-ordering-behavior-india-50k-orders)
50,000 orders with order time, day type, meal type, restaurant type, order value, delivery fee, ratings, customer mood, hunger level, city, and demographic features. Used to enhance temporal and demographic modeling, identifying peak ordering periods correlated with traffic and congestion.
c. India's Fast Delivery Agents Reviews and Ratings (Source: Kaggle — kanakbaghel/indias-fast-delivery-agents-reviews-and-ratings)
Reviews and ratings of individual delivery agents. Provides a qualitative dimension to the risk model, capturing riders' lived experiences (weather conditions, unsafe neighborhoods, traffic problems) through NLP-extracted sentiment and risk perception.
d. India Weather Forecast (103 Cities) (Source: Kaggle — itzdhruv45/india-weather-forecast-103-cities)
Weather observations for 103 Indian cities — temperature, cloud cover, precipitation, humidity, wind speed/direction, and overall condition. Serves as a primary environmental risk factor for triggering safety alerts and gear recommendations.
e. Food Delivery Dataset (Location & Order Attributes) (Source: Kaggle — varshinipallerla/food-delivery)
Combines delivery and restaurant information — delivery distance, route characteristics, weather condition labels, customer ratings, and traffic conditions. Provides route and traffic insights and supports regression modeling of delays and rider strain.
3. Methodology
The project adopts a multi-stage, data-driven methodology using Terno AI to integrate, analyze, and model risk for delivery workers:
- Data Collection and Preprocessing — Collect datasets on delivery performance, customer reviews, traffic accidents, weather/pollution, and crime statistics; use Terno AI for cleaning, standardizing timestamps and city names, handling missing values, and anonymizing sensitive data; perform exploratory data analysis (EDA).
- Feature Engineering and Risk Quantification — Generate spatiotemporal features (accident density, traffic congestion, pollution exposure, weather hazards, time-of-day effects); extract sentiment/risk indicators from reviews via NLP; compute composite Delivery Risk Scores.
- Predictive Modeling and Recommendation System — Develop ML models to predict delivery risk, expected delays, and hazard-prone zones; generate actionable recommendations (safe hours, preferred routes, protective gear); validate against historical data.
- Visualization and Dashboard Development — Build interactive dashboards showing risk heatmaps, temporal risk trends, and safety recommendations for platform managers and policymakers.
- Evaluation and Social Impact Assessment — Simulate effectiveness of recommendations in reducing accidents, pollution exposure, and unsafe deliveries; assess improved worker safety and efficiency.
Limitations of Existing Approaches
Last-mile delivery platforms like Swiggy, Zomato, and Dunzo primarily use algorithms that minimize delivery time and distance, incorporating traffic data or customer ratings — but these approaches show significant limitations:
- Fragmented Data Utilization — Most systems rely on a single data source without integrating environmental, social, and infrastructural factors.
- Neglect of Worker-Centric Risks — Efficiency metrics dominate, overlooking exposure to pollution, adverse weather, accident-prone zones, or unsafe neighborhoods.
- Limited Predictive Capability — Current models lack spatiotemporal risk analytics combining accident data, crime reports, weather, and rider feedback.
- Minimal Worker Engagement — Delivery agents' unstructured feedback is largely underutilized in operational decision-making.
Terno AI as the Proposed Solution
Terno AI offers several advantages for this context:
- Multi-Source Data Integration — seamlessly merges delivery records, rider reviews, traffic accidents, weather/pollution data, and crime statistics into a holistic risk profile.
- Advanced Analytics and Predictive Modeling — supports regression, classification, and spatiotemporal modeling to predict delays, identify high-risk zones, and compute composite risk scores.
- Actionable Recommendation Generation — produces real-time recommendations on optimal working hours, safest routes, and protective gear.
- Interactive Visualization and Dashboards — presents insights via intuitive dashboards for workers and platform managers.
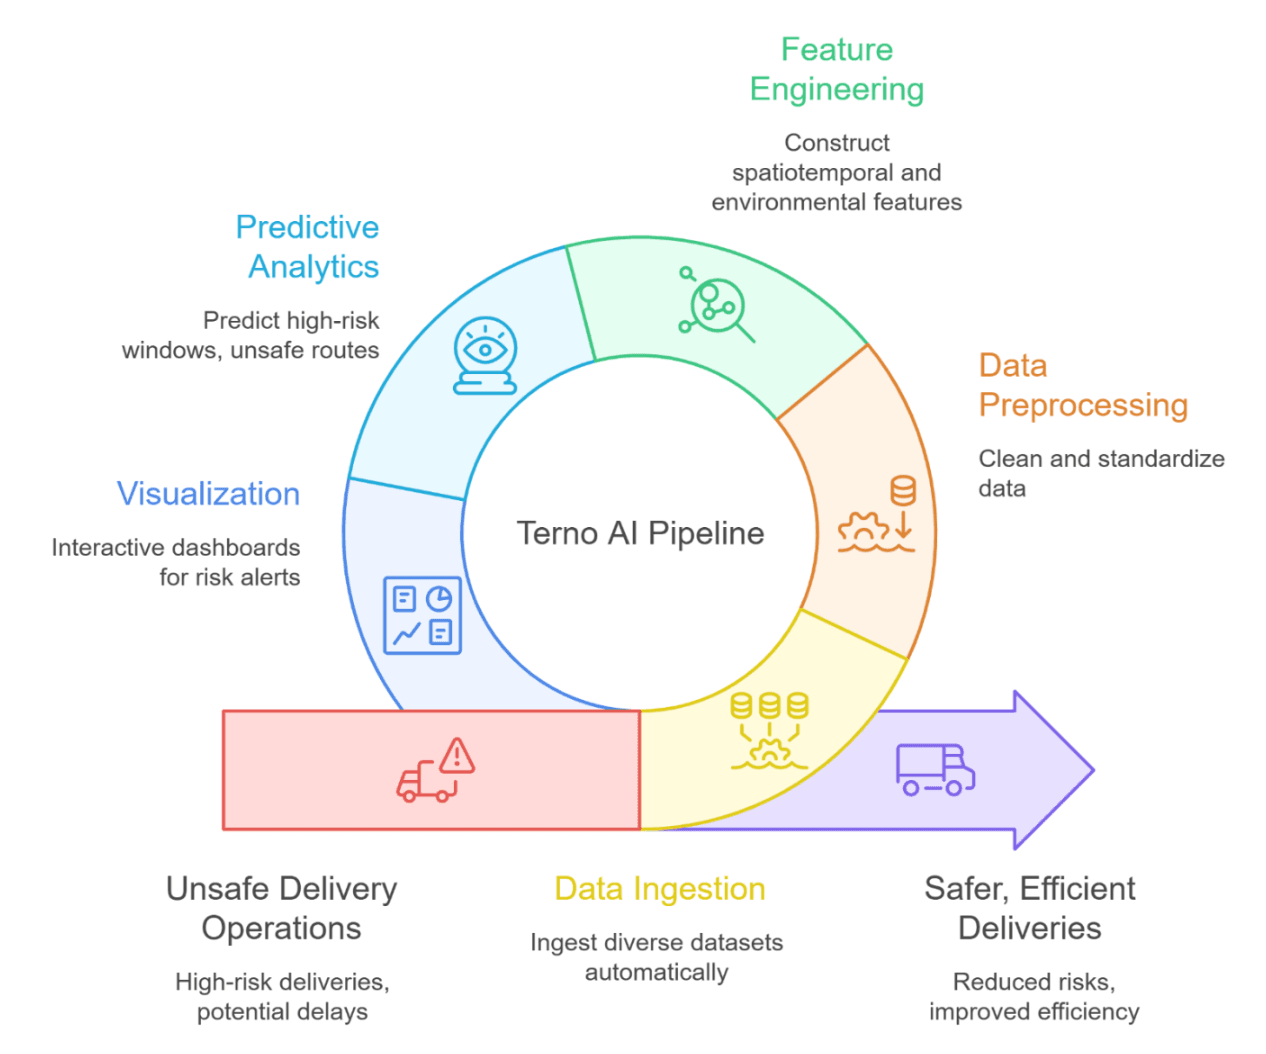
Terno AI interacts with the data through: (1) Data Ingestion of all datasets with automatic format/timestamp/location standardization, (2) Preprocessing and Cleaning including NLP-based sentiment extraction from reviews, (3) Feature Engineering and Risk Scoring combining traffic density, pollution exposure, weather severity, and worker-reported challenges, (4) Predictive Analytics forecasting high-risk windows and unsafe routes, and (5) Visualization and Decision Support through interactive dashboards. In essence, Terno AI acts as the central engine that turns raw data into actionable intelligence for safer, more efficient delivery operations.
4. Results and Evaluation
4.1 Overview of Delivery Operations and Exposure to Risk
Delivery agents operate under continuous and evenly distributed demand, with an average delivery distance of ~14.3 km and orders spread across all time periods (morning, afternoon, evening, night) — meaning delivery activity is not confined to specific peak windows but persists throughout the day.
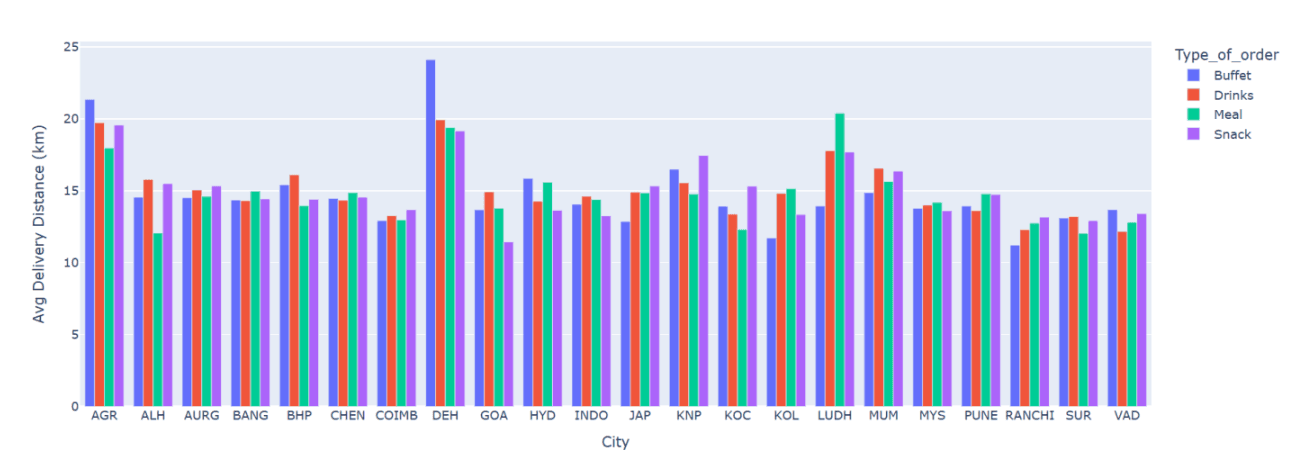
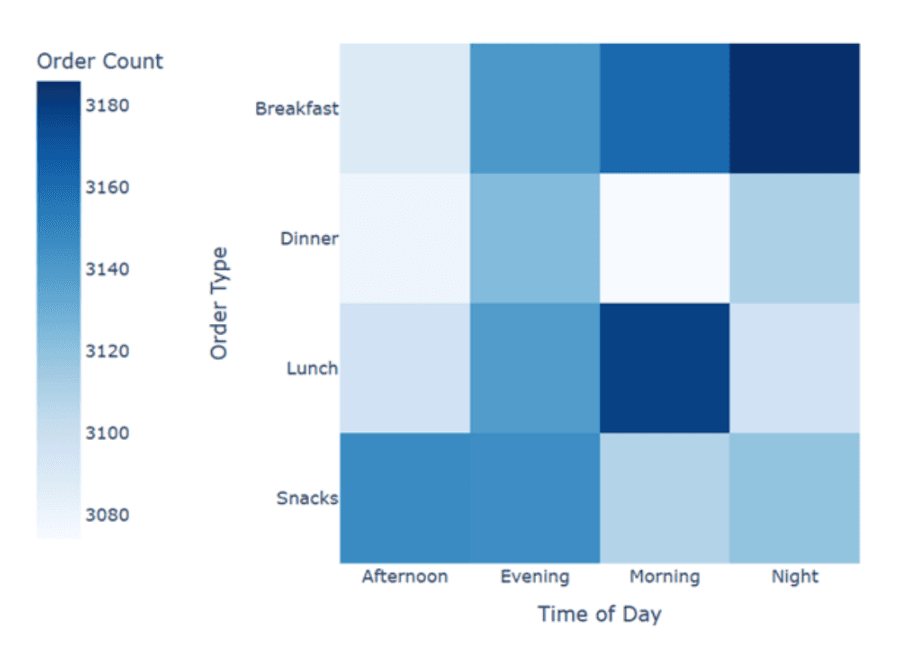
Unlike traditional occupations with defined high-risk periods, delivery work demonstrates a persistent exposure model — risk accumulates gradually due to prolonged time on the road, with limited rest/recovery windows increasing cumulative fatigue. The dominance of two-wheeler vehicles (primarily motorcycles and scooters) further amplifies vulnerability, since these vehicles offer minimal physical protection in congested traffic.
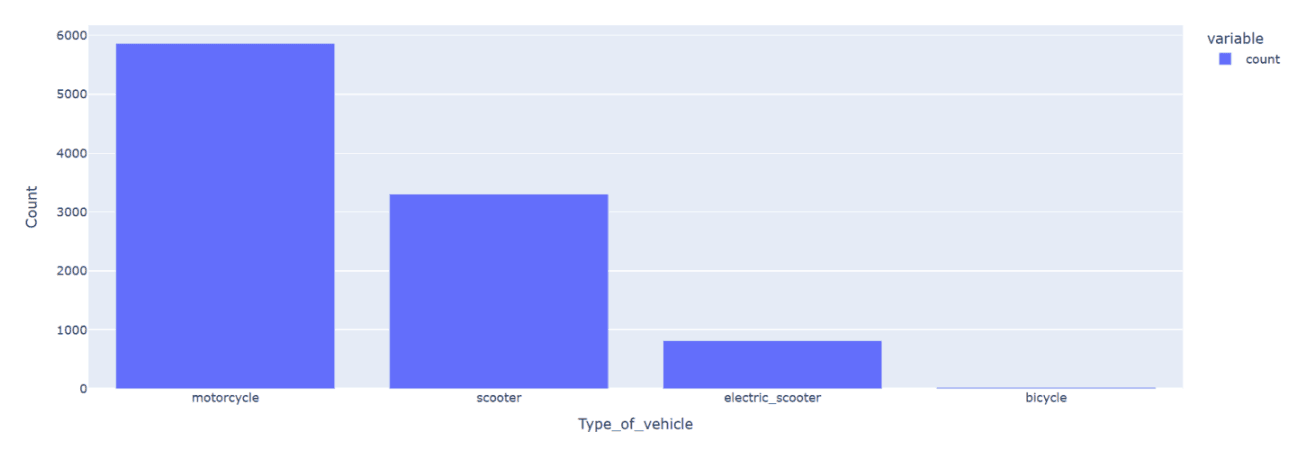
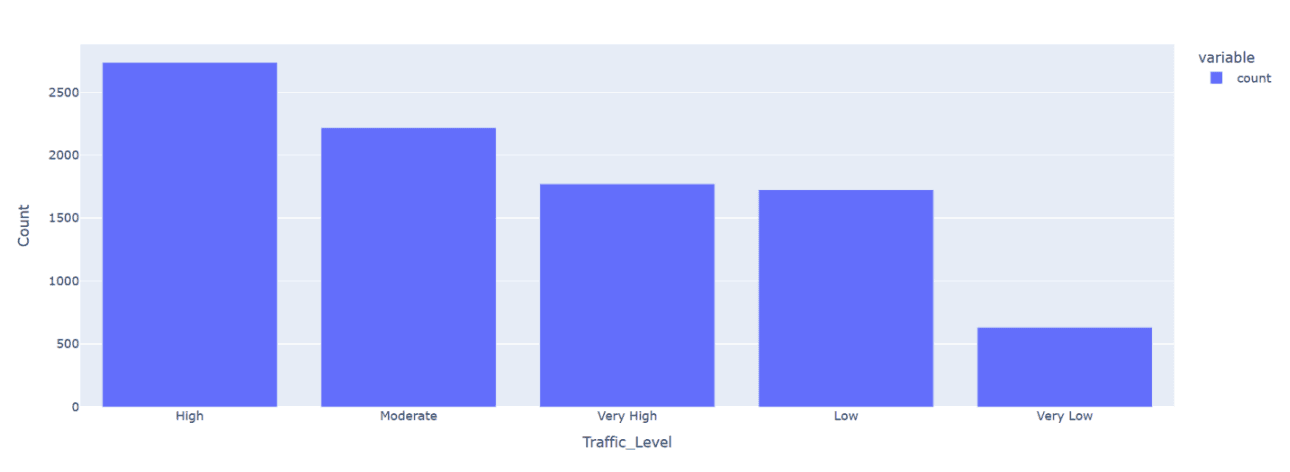
Discussion: These findings highlight a structural characteristic of gig-based delivery systems — risk is embedded within the operational model itself. The continuous flow of orders across time and order types creates an environment of sustained, unpredictable exposure to dynamic road conditions, aligning with existing literature on the lack of regulated schedules and institutional safety buffers in gig work. Delivery risk should therefore be understood as a function of sustained exposure and operational intensity, not a series of isolated incidents.
4.2 Environmental Determinants of Risk: Traffic and Weather
Traffic density emerges as one of the most significant determinants of delivery risk, with a strong positive correlation (r = 0.83) between traffic levels and risk scores. As traffic density increases, both collision likelihood and delivery time (thus exposure duration) rise.
Weather conditions further amplify risk, though the relationship is more nuanced than a simple "bad weather = higher delay" assumption — delivery time actually peaks under overcast conditions, then gradually decreases across fog, scattered clouds, smoke, clear sky, broken clouds, few clouds, mist, and haze.
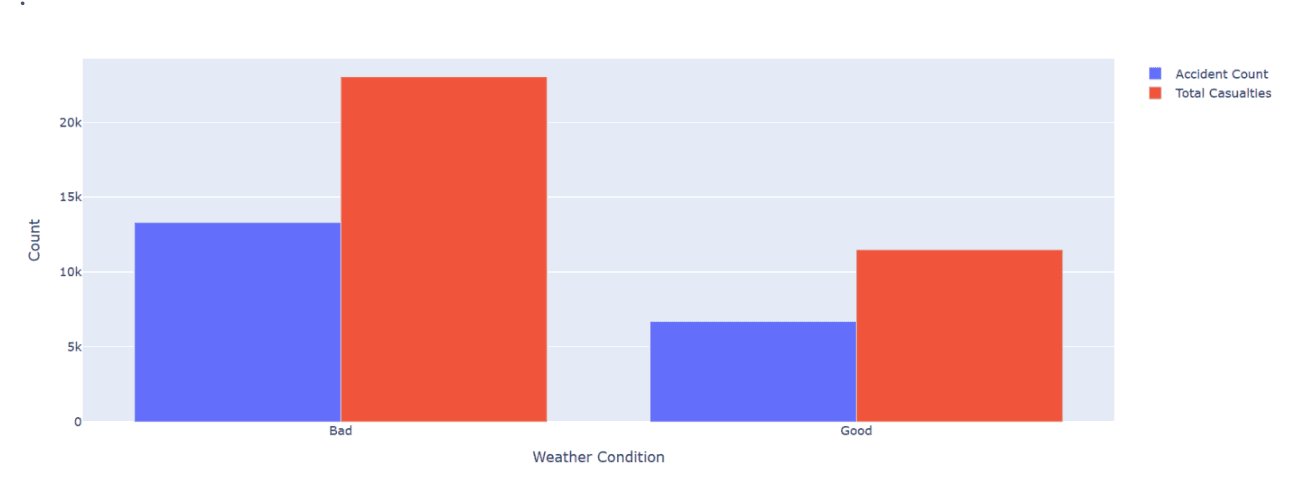
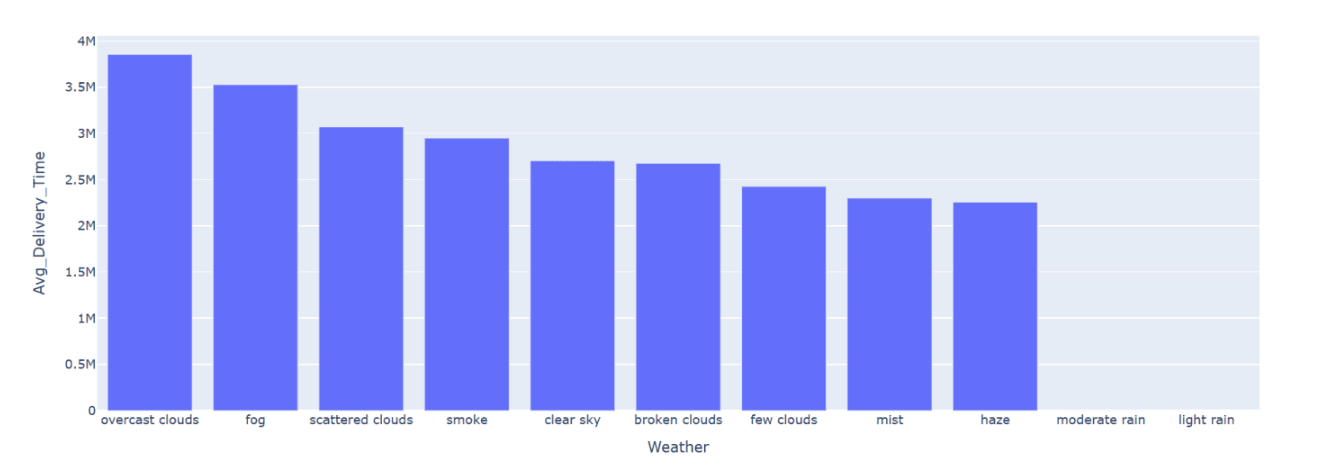
This pattern suggests perceived vs. actual risk conditions differ operationally: extreme weather (heavy rain, storms) may reduce delivery activity and produce route adjustments, resulting in fewer recorded delivery instances — while "mild" conditions like overcast skies or fog may not trigger operational caution, yet still create subtle, significant driving challenges (reduced contrast, damp roads, driver complacency). Broader accident analysis confirms that accident frequency nearly doubles under adverse weather.
Discussion: These findings reinforce the concept of compound and non-linear risk, where environmental factors interact in complex ways:
High traffic + overcast conditions → longer exposure and reduced visibility without behavioral adjustment
Moderate traffic + fog → sudden visibility loss and delayed reaction times
Low traffic + severe weather → fewer deliveries but higher per-trip risk
Current delivery optimization systems predominantly prioritize speed and efficiency, often neglecting these nuanced environmental interactions — incentivizing agents to maintain delivery timelines even under suboptimal conditions and increasing their vulnerability. Context-aware delivery systems should adjust delivery time expectations based on real-time traffic and weather, incorporate risk-weighted routing, and provide adaptive safety recommendations.
4.3 Spatial Variations in Risk Across Cities
The study reveals pronounced spatial disparities in delivery-related risk across Indian cities. Chandigarh, Bangalore, Hyderabad, Chennai, and Delhi consistently exhibit higher average risk scores — reflecting a convergence of elevated traffic density, congested road networks, frequent signalized intersections, and higher accident frequencies, along with more variable air quality and weather conditions.
In contrast, Mumbai demonstrates comparatively lower risk despite being densely populated — potentially due to better traffic flow management in certain zones, shorter average delivery distances, and greater agent familiarity with local navigation.
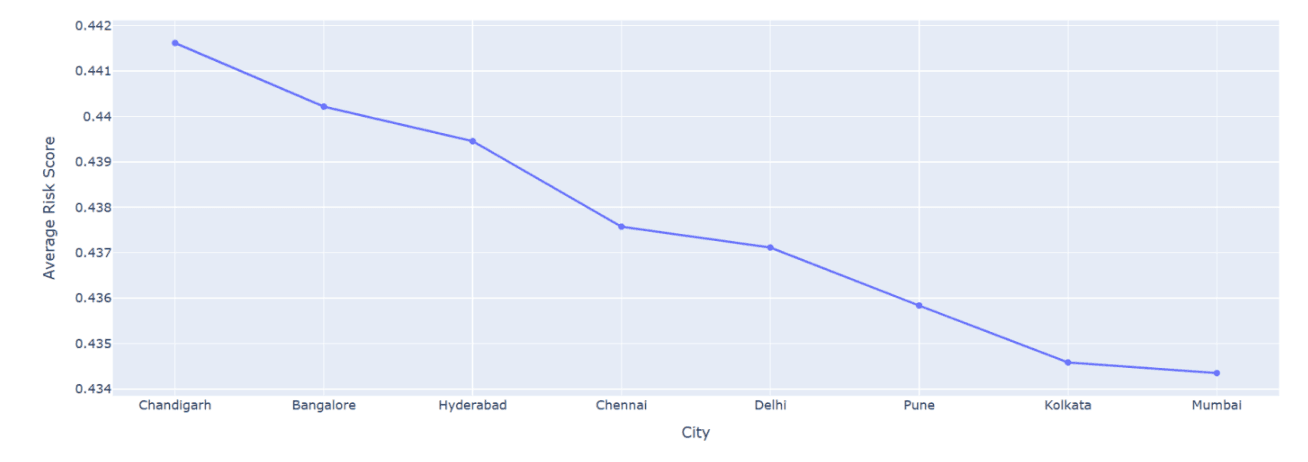
From a data-driven perspective, the composite risk score shows clear clustering at the city level — high-risk cities score consistently higher across multiple contributing parameters rather than a single dominant factor, indicating a systemic rather than isolated risk structure.
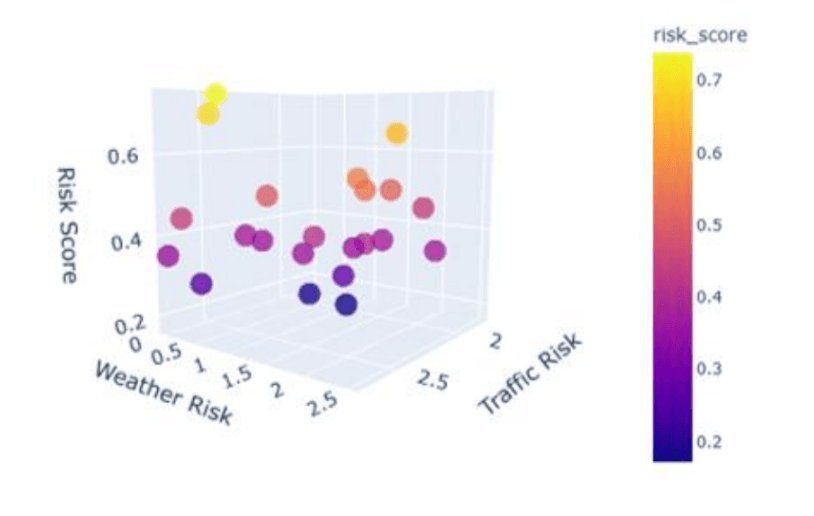
Discussion: High-risk cities are typically characterized by chronic congestion, inefficient traffic signal systems, inconsistent rule enforcement, and infrastructural bottlenecks. This suggests delivery risk should be viewed as an emergent property of urban systems, requiring a multi-stakeholder approach involving delivery platforms, urban planners, and traffic authorities. For businesses, this has strategic implications: a uniform service promise (e.g., fixed delivery time targets) may not be viable across cities with differing infrastructural constraints — localized strategies balancing efficiency with agent safety are essential.
4.4 Operational Factors: Distance, Time, and Delivery Type
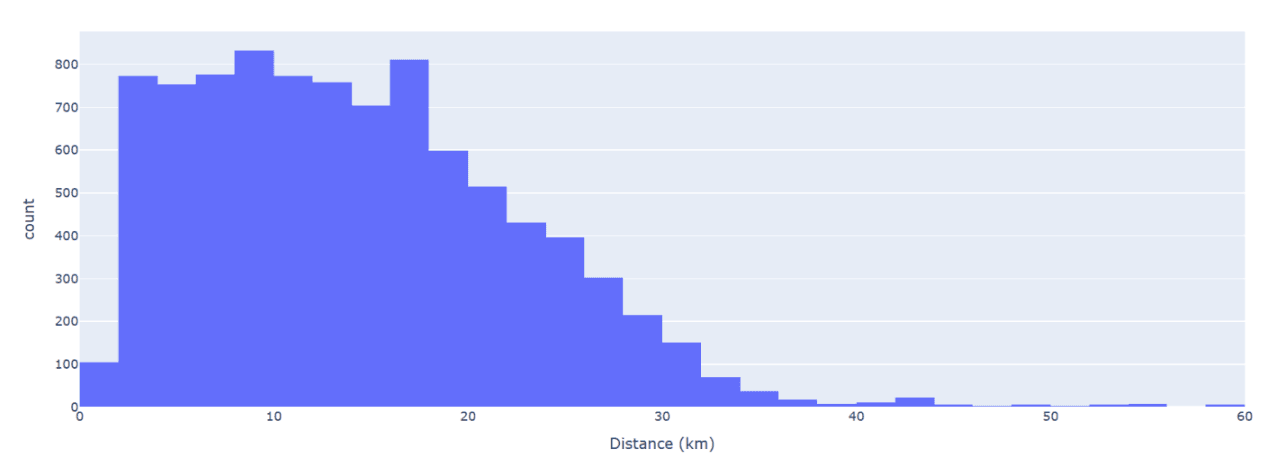
Delivery distance (~14.3 km average) remains a central determinant of risk exposure — longer routes increase the likelihood of encountering multiple risk factors simultaneously.
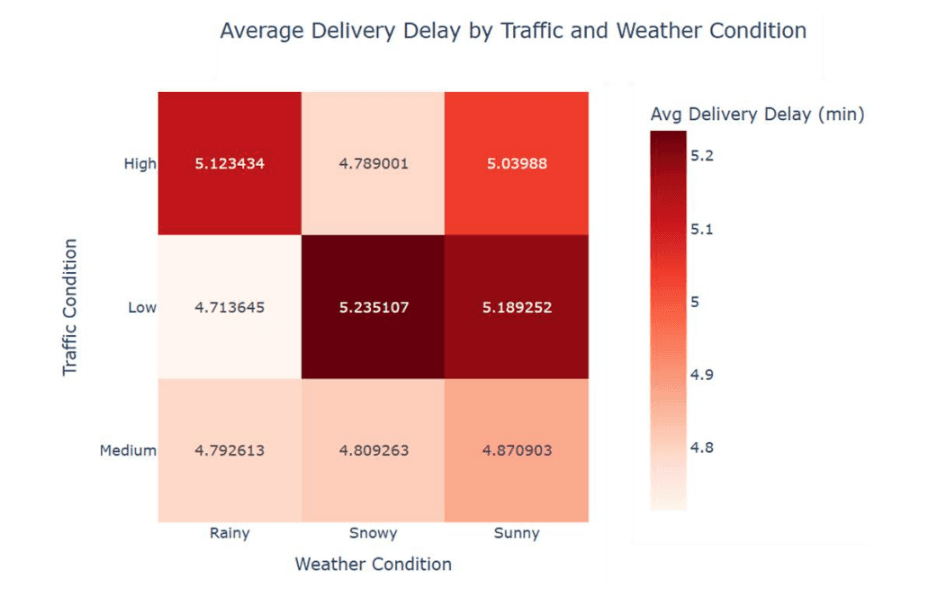
Despite variations in traffic and weather, average delivery delay remains relatively low (typically under ~6 minutes) across different traffic-weather combinations — even high traffic and rainy conditions only marginally increase delays compared to baseline. This indicates delivery systems are highly optimized for time efficiency — but is that optimization considering delivery agent safety? That is doubted.
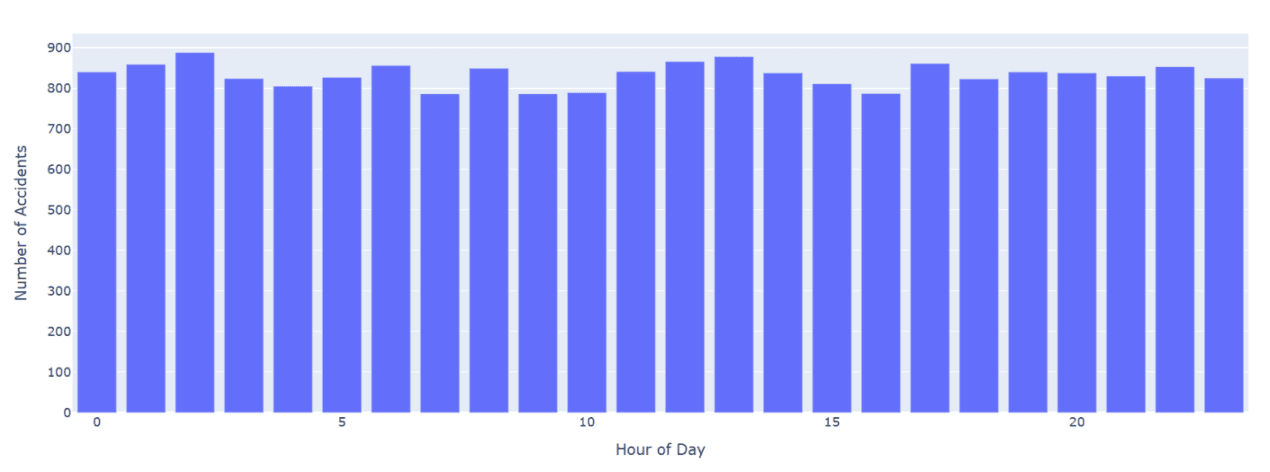
Delivery demand is distributed relatively uniformly across time periods — agents are continuously active rather than concentrated in short peak windows.
Discussion: These findings highlight a critical paradox: time efficiency is maintained at the cost of increased risk exposure. The small variation in delivery delays under harsh conditions suggests agents compensate for external challenges through behavioral adaptations — increased speed, riskier maneuvers, or reduced compliance with safety norms.
This reinforces that operational optimization models are heavily biased toward performance metrics (speed, delivery time SLAs) while underweighting safety — the system absorbs environmental disruptions not by slowing down, but by transferring the burden of adaptation onto delivery agents. Risk is not reflected in delivery time metrics alone, making it an invisible but critical factor in system design. Platforms must incorporate risk-aware routing and allocation strategies: dynamic distance thresholds, adaptive delivery time promises accounting for safety, and intelligent order clustering to reduce unnecessary travel distances.
4.5 Social and Behavioral Risk Dimensions
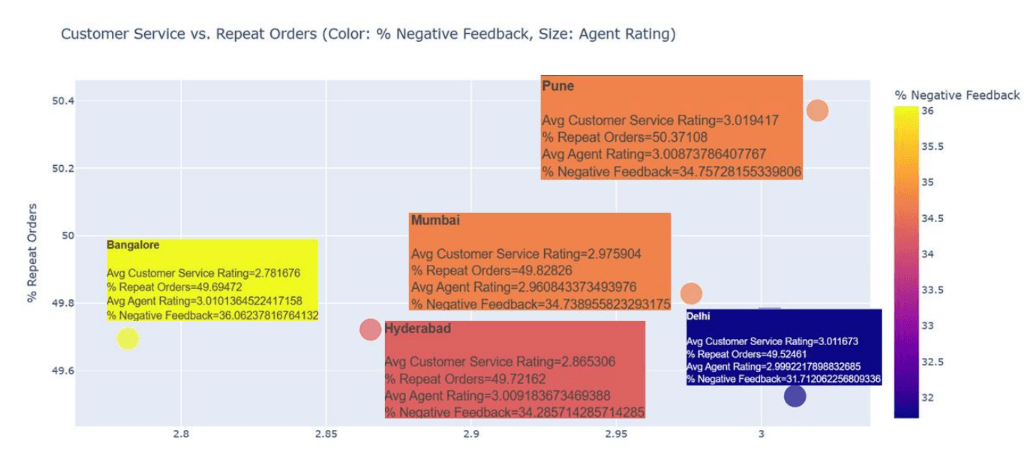
Customer behavior emerges as a significant, often-overlooked contributor to delivery risk. Indicators such as low customer service ratings, high incorrect order rates, and negative feedback patterns are associated with stressful customer-agent interactions. Certain cities exhibit higher "bad behavior scores," suggesting geographic variation in customer-agent interactions.
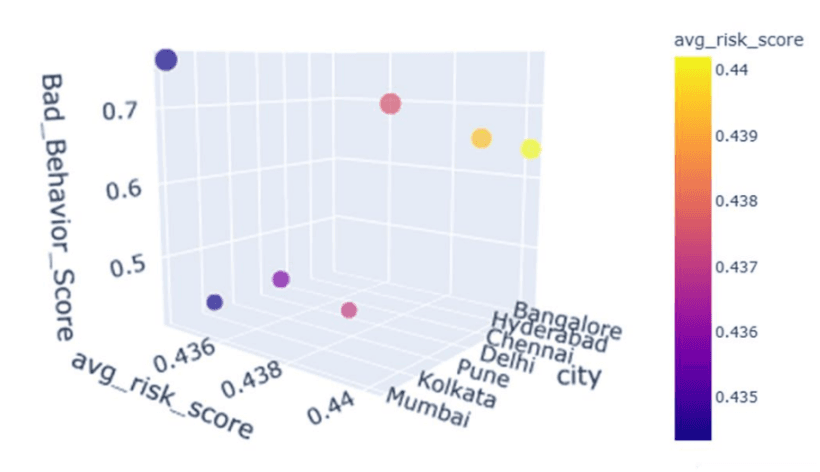
Discussion: This introduces a psychosocial dimension of risk — stress, dissatisfaction, and conflict may lead to unsafe driving behaviors such as speeding or distraction. Delivery agents operating under pressure to meet expectations or avoid negative ratings may take greater risks on the road, extending the understanding of delivery risk beyond physical hazards to behavioral and emotional stressors.
4.6 Health Risks from Environmental Exposure (Air Quality)
Delivery agents in highly polluted cities face significant exposure to harmful pollutants, particularly PM2.5.
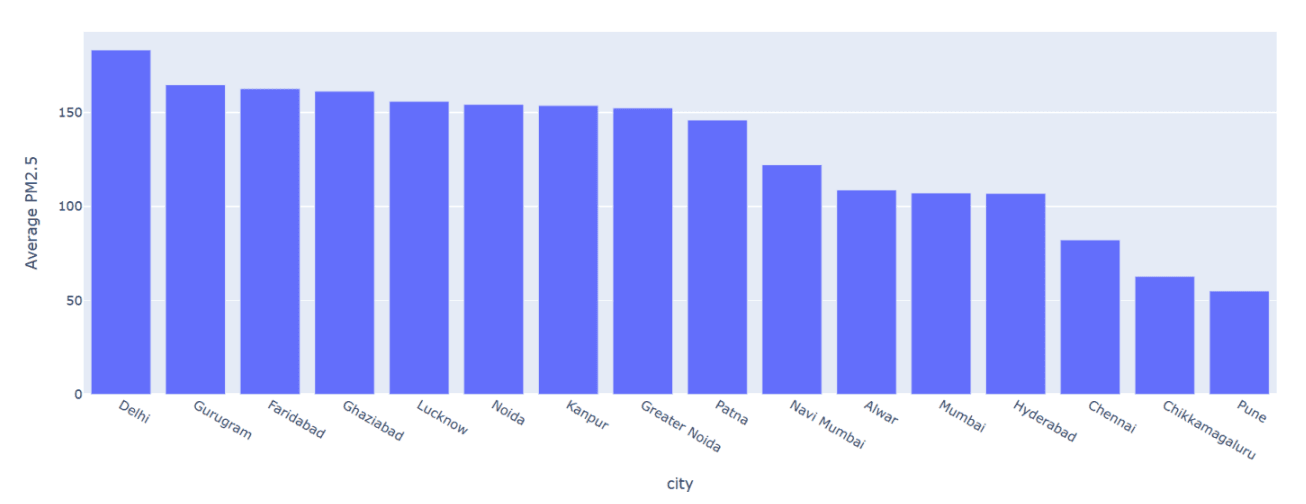
Discussion: While not directly linked to immediate accident risk, poor air quality contributes to long-term health issues and may indirectly affect driving performance through reduced visibility and fatigue — underscoring the importance of considering chronic health risks alongside acute safety risks, an indicator largely absent from current delivery platform operational models.
4.7 Accident Risk Patterns and Key Contributing Factors
Road accident data shows accidents concentrate around peak traffic hours, high traffic density, poor visibility, and adverse weather. Key causes include overspeeding, driver distraction, and poor road conditions. The temporal distribution of accidents overlaps with high-demand delivery periods — meaning delivery agents are most active during inherently unsafe conditions, suggesting that market demand directly drives exposure to risk.
4.8 Integrated Risk Modeling and Feature Importance
A SHAP-based analysis identifies the most influential factors contributing to delivery agent risk:
Traffic density
Peak hours and weekends
Weather conditions
Temperature
Delivery distance
Traffic signals and intersections
Regional factors
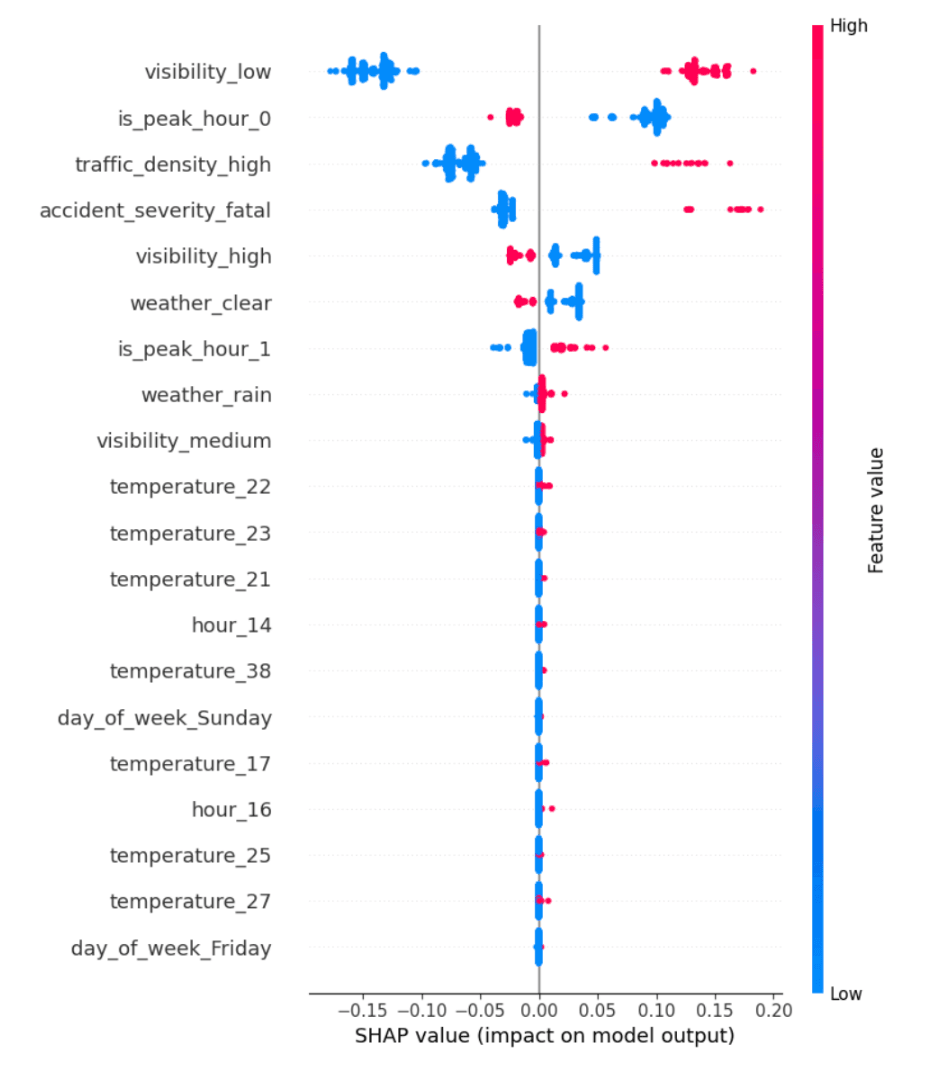
Discussion: The results confirm that delivery risk is inherently multidimensional, influenced by environmental, temporal, spatial, and operational variables. No single factor dominates risk entirely — risk emerges from the interaction of multiple variables, validating the need for an integrated analytical framework.
4.9 Relationship Between Service Quality and Risk
Correlation analysis between customer service ratings and risk proxies (delivery time and order accuracy) suggests lower service ratings are associated with higher delivery times and operational inefficiencies.
Discussion: Poor service environments may indirectly increase risk by creating pressure on delivery agents — attempts to compensate for delays or errors may result in riskier driving behavior. Improving service quality may therefore also contribute to reducing operational risk.
4.10 Synthesis of Findings: A Multi-Dimensional Risk Framework
The findings collectively demonstrate that delivery agent risk is shaped by the interaction of:
Environmental: weather, air quality
Infrastructural: traffic density, road conditions
Operational: delivery distance, time pressure
Social: customer behavior and feedback
Temporal: peak hours and weekends
Discussion: Current delivery systems largely optimize for efficiency and cost, neglecting these interconnected risk factors — resulting in delivery agents being systematically exposed to unsafe conditions. This study highlights the need for a paradigm shift from efficiency-driven models to risk-aware delivery systems, where safety is integrated into routing, scheduling, and operational decision-making.
5. Practical Application: Using Terno AI to Choose a New City for Delivery Logistics Expansion
How can Terno AI help take data-driven decisions to open a delivery logistics business in a new location in India?
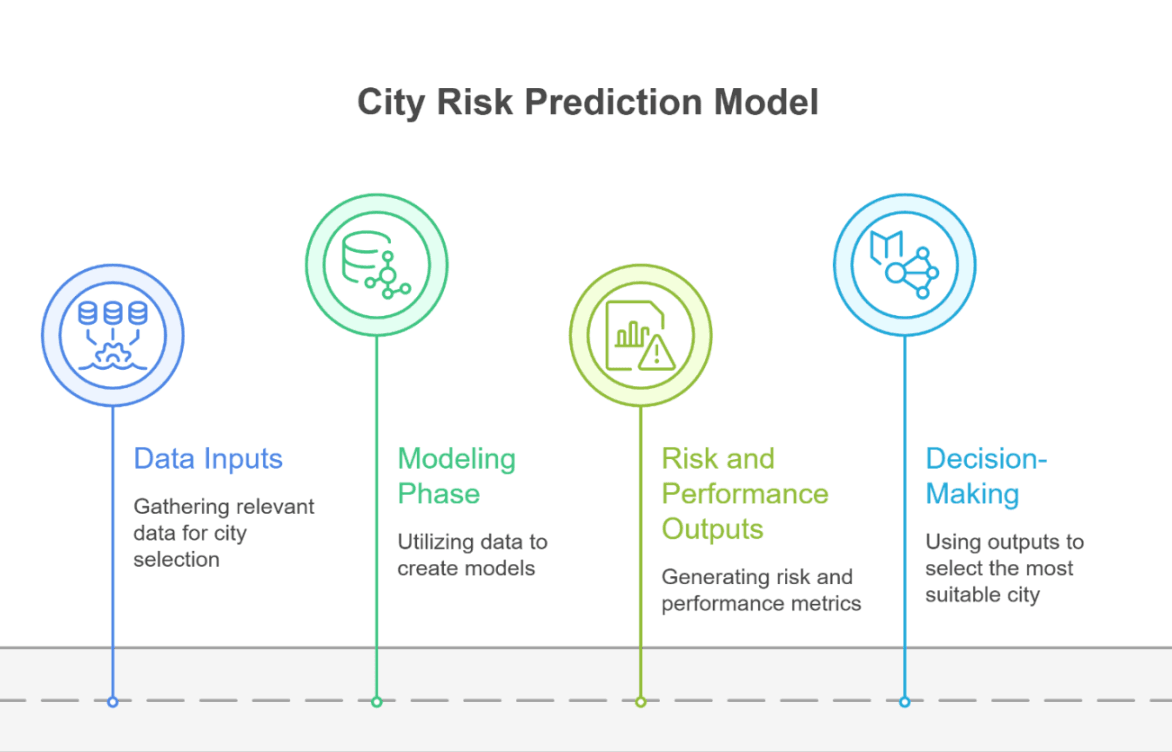
This analysis illustrates how Terno AI functions as a practical decision-support tool for identifying suitable cities for launching delivery logistics operations — integrating delivery performance, customer behavior, weather patterns, and road risk indicators for a multi-dimensional evaluation of both opportunity and risk, rather than relying on single metrics like delivery time or demand volume alone.
5.1 Decision Framework for City Selection
The analytical framework is structured around three complementary components:
Predictive Risk Assessment: Machine learning models (Random Forest and XGBoost) estimate a continuous
risk_score, capturing the combined effects of traffic density, visibility, weather, and accident-related variables.Operational Performance Indicators: Delivery datasets indicate average delays remain relatively stable (~5 minutes) even under adverse conditions — raising questions about the relationship between speed and safety.
Demand-Side Metrics: Customer behavior data (order frequency, repeat purchases, satisfaction levels) provides insight into the commercial viability of each city.
5.2 Interpreting the Risk–Efficiency Trade-off
A key finding is the weak variation in delivery delays across different traffic and weather conditions:
High traffic + rainy weather → average delay of approximately 5.12 minutes
Low traffic + snowy conditions → similar delay (~5.24 minutes)
This narrow range indicates that delivery systems are optimized to maintain time efficiency regardless of external conditions — meaning delivery time is not a reliable proxy for operational safety. The system appears to absorb environmental variability without significant performance degradation, potentially shifting the burden of risk onto delivery agents. This reinforces the need for independent risk modeling, rather than inferring safety conditions from efficiency metrics alone.
5.3 Model-Based vs. Rule-Based Risk Estimation
Two distinct approaches were used to estimate city-level risk:
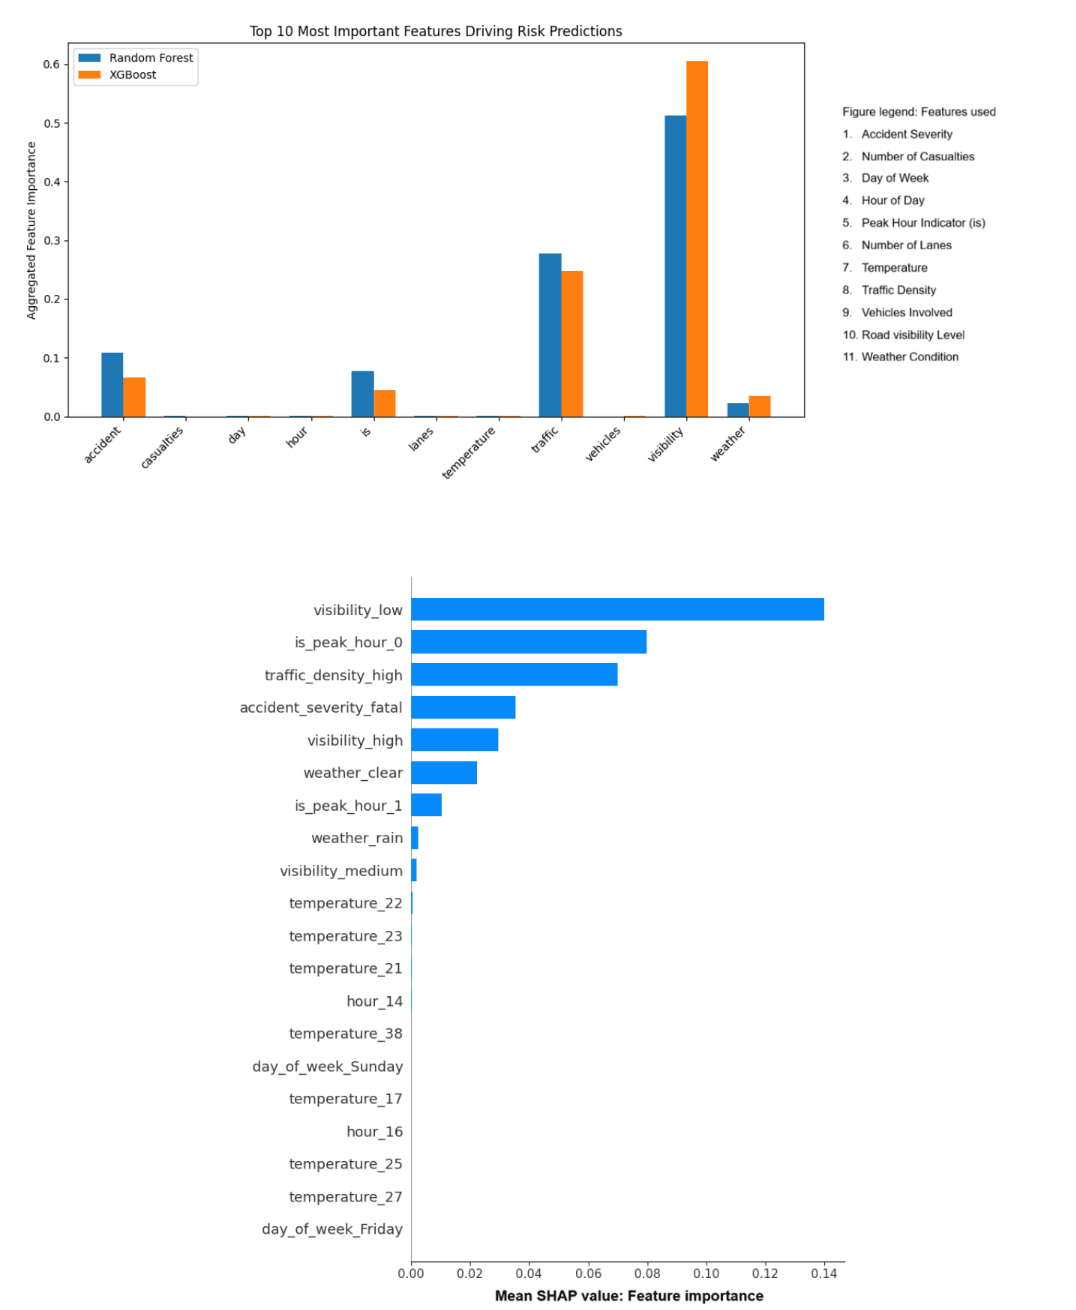
Machine Learning-Based Approach (Terno AI): Models trained on road and environmental data capture non-linear interactions between variables. Feature importance and SHAP analysis indicate visibility and traffic density are the dominant predictors, followed by weather and accident-related features.
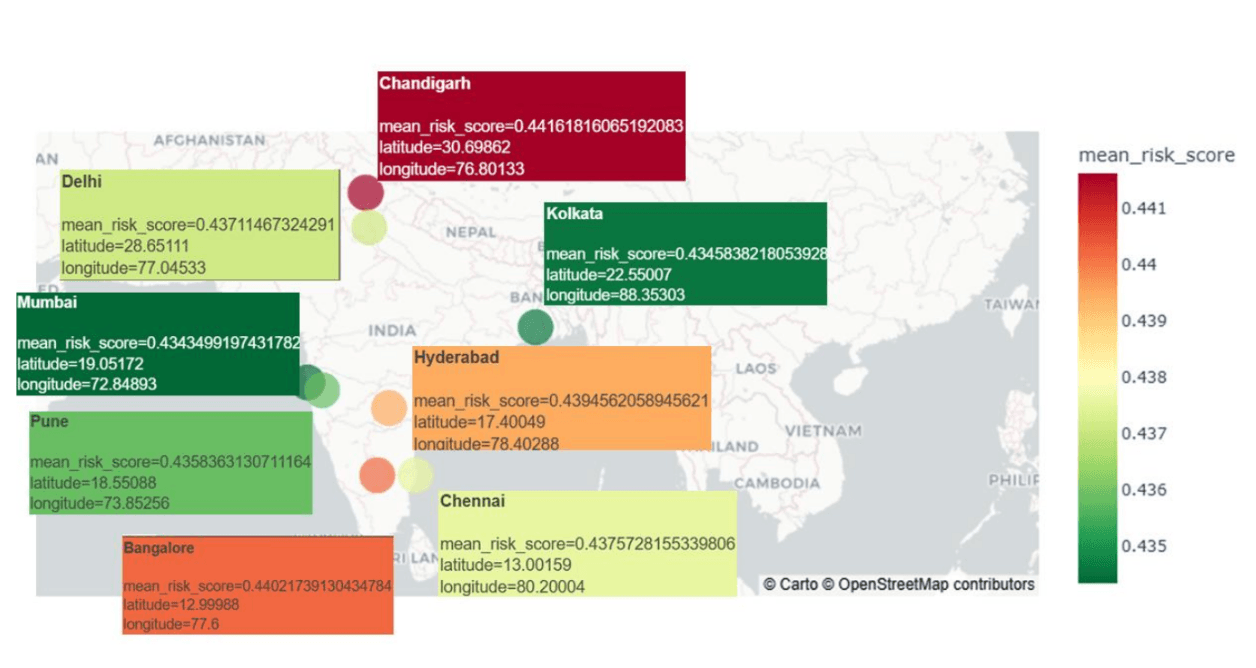
Numerical (Rule-Based) Approach: A Python-based scoring method using aggregated averages identified Bangalore as the highest-risk city and Delhi as the lowest-risk city.
While both approaches produce interpretable outputs, machine learning-based prediction is more reliable than rule-based approaches — it captures complex, non-linear relationships between multiple factors (traffic density, visibility, weather, road conditions, time) simultaneously. A rule-based model simplifies these relationships using fixed assumptions, potentially overlooking important patterns. ML models learn directly from historical data, adapt to trends, and generalize better to new scenarios — better suited for operational decision-making.
5.4 Evaluation of Model Reliability
The machine learning models demonstrate very high predictive performance (R² ≈ 0.998), with minimal difference between training and testing results, suggesting strong generalization and robustness.
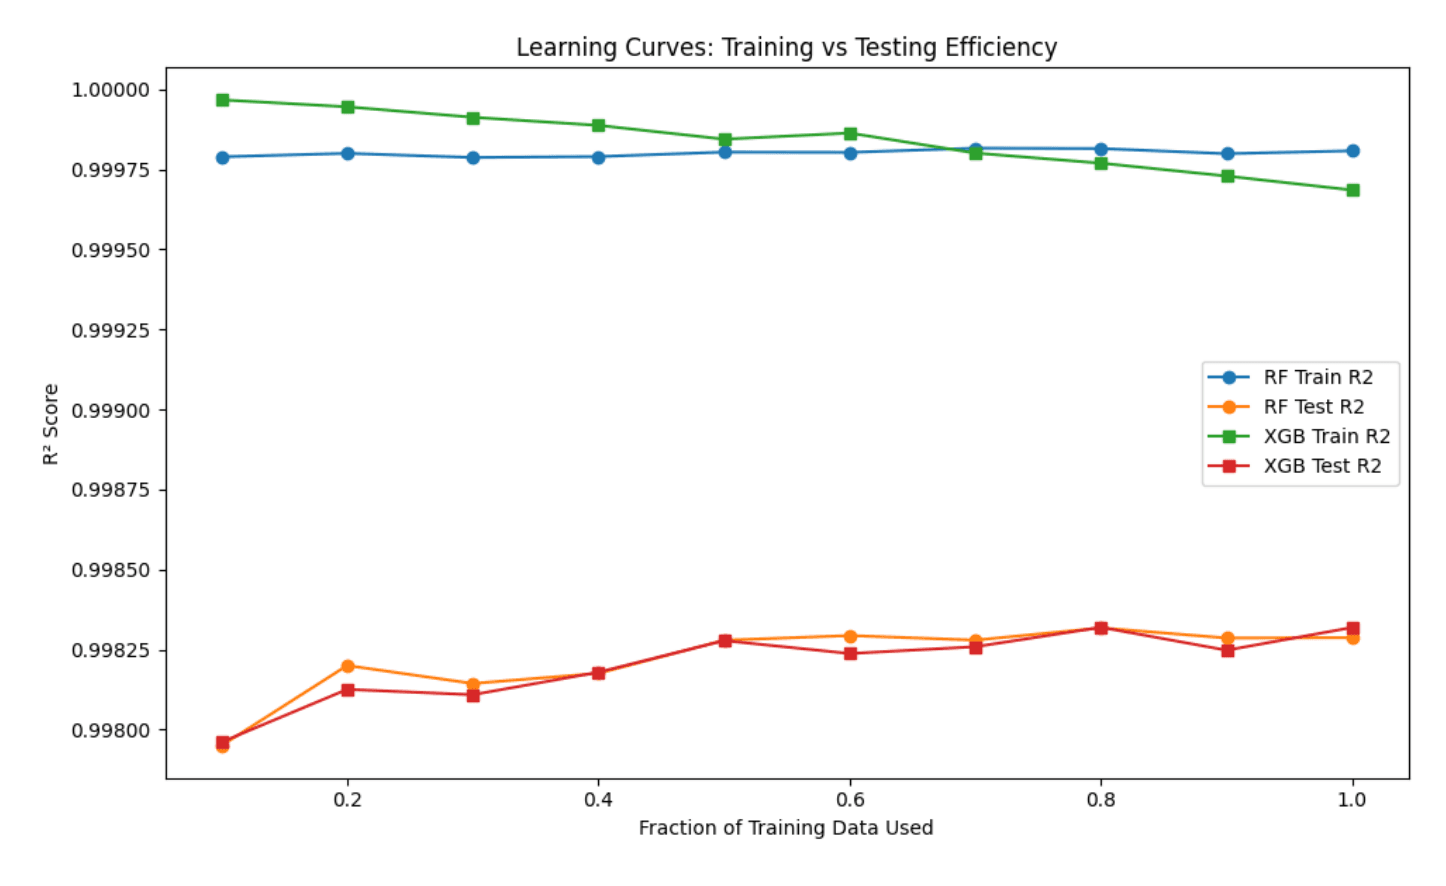
Rule-based methods are useful for initial screening, while machine learning models are more appropriate for operational decision-making and scenario simulation.
5.5 Predictive Generalization and Factor-Level Comparison Across Cities
Beyond predicting risk scores for unseen cities, the objective is to understand what is driving those risks — comparing cities not just on outcomes, but on underlying contributing conditions.
Using an aligned 100-feature input structure, the XGBoost model was successfully deployed to estimate risk scores for previously unseen cities.
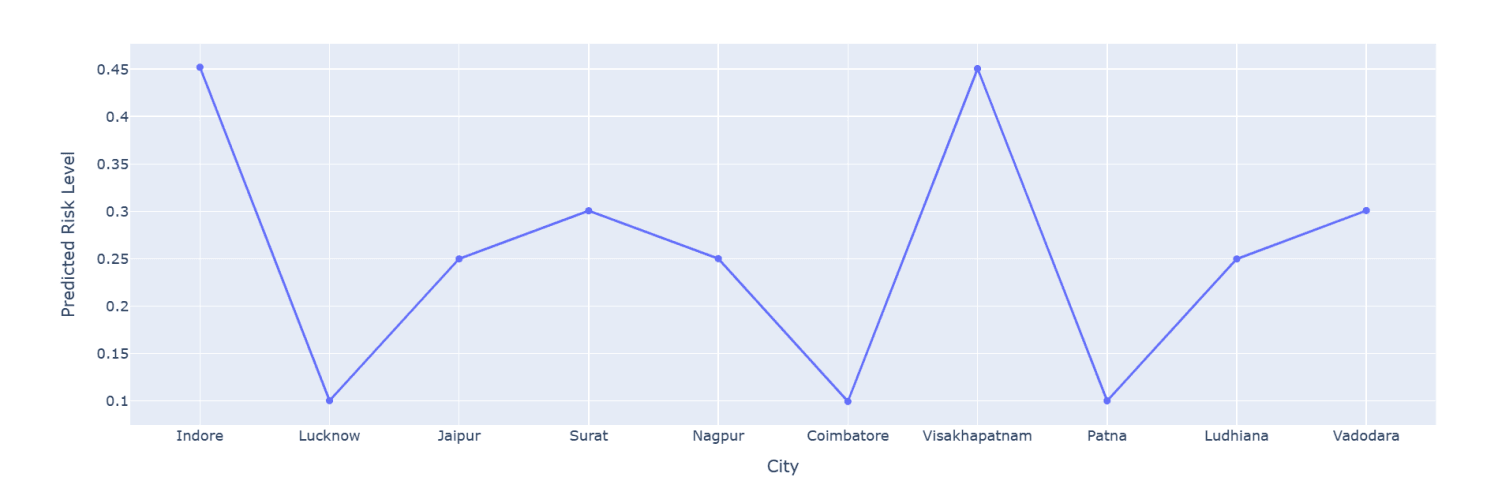
At a high level, the model identifies a clear spread between high-risk, moderate-risk, and low-risk urban environments, even though these cities were not part of the training data.
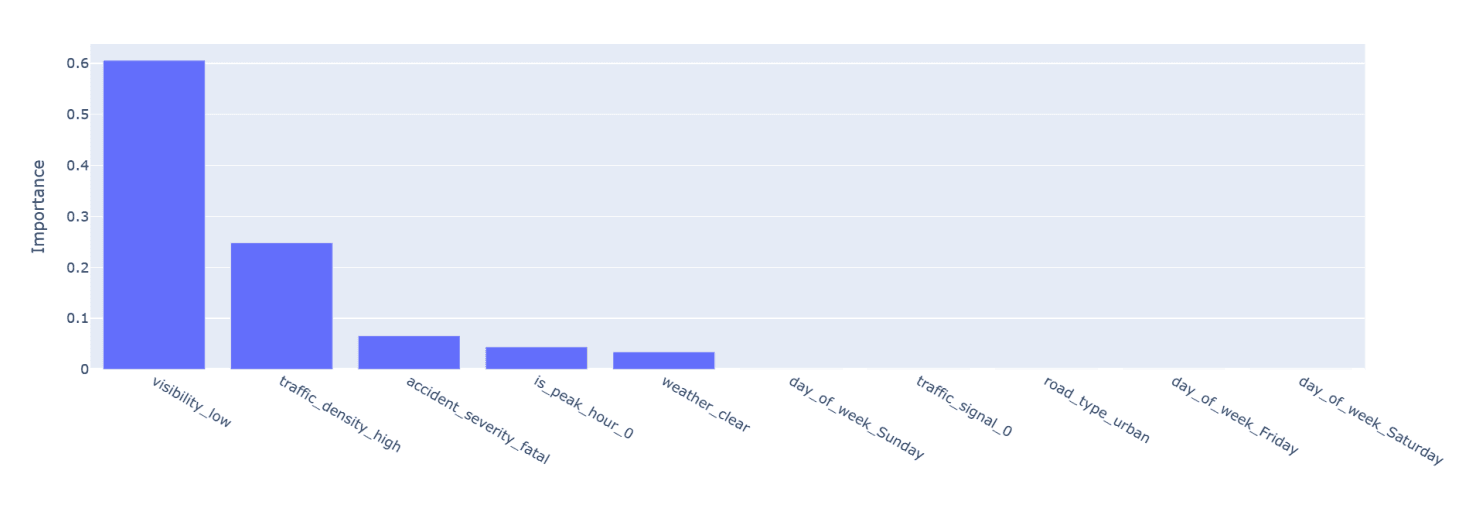
Understanding What Drives Risk: Feature importance from the XGBoost model shows a small number of variables dominate:
Low visibility (~61%)
High traffic density (~25%)
Fatal accident severity (~7%)
Peak-hour dynamics (~4%)
Weather conditions (~3%)
City-Level Comparison of Risk Factors:
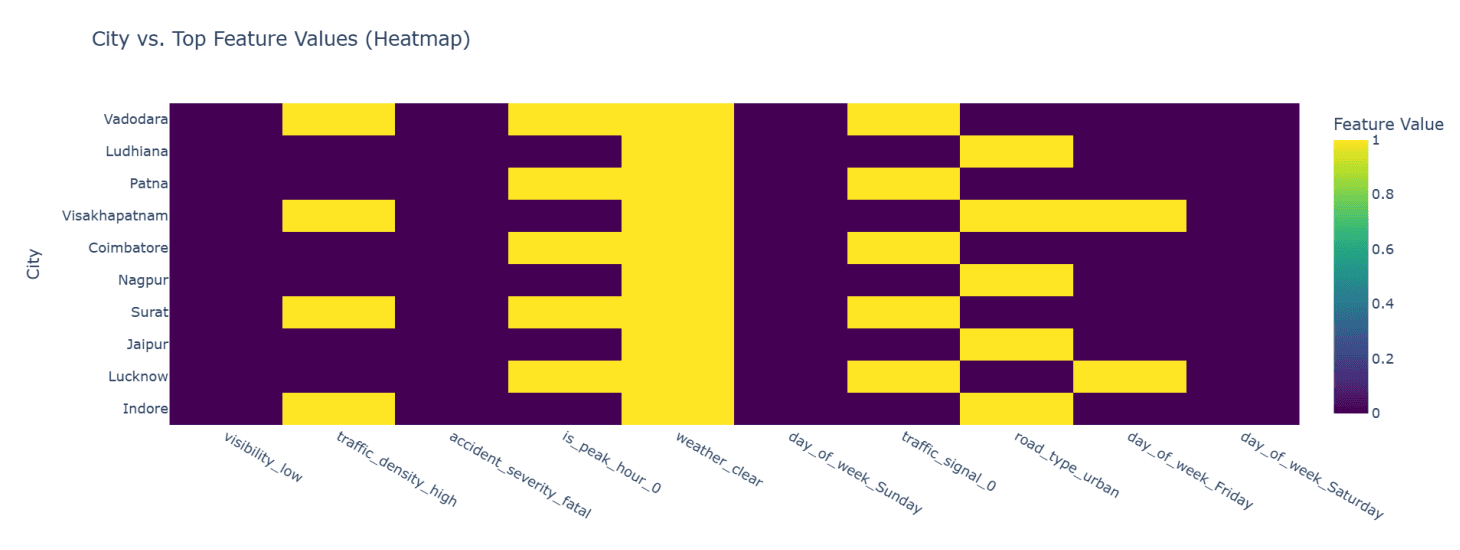
A few patterns emerge clearly:
High-Risk Cities (Indore, Visakhapatnam): Strong co-occurrence of low visibility and high traffic density — a combination that compounds risk through reduced reaction time in already congested environments.
Moderate-Risk Cities (Surat, Vadodara, Jaipur): A mixed profile — some exposure to low visibility or congestion, but not consistently across all conditions (e.g., Vadodara's lower visibility is likely episodic, tied to winter fog or monsoon rainfall).
Low-Risk Cities (Coimbatore, Patna, Lucknow): Generally lack the dominant high-risk triggers — better visibility conditions and lower/more stable traffic density.
Why Visibility Emerges as the Dominant Factor: From a modeling standpoint, binary features like visibility_low create strong decision splits in tree-based models, and the model repeatedly uses this variable because it reduces prediction error effectively. From a domain perspective, this is intuitive — low visibility directly impacts driver perception, reaction time, and situational awareness, and is often associated with fog, heavy rain, or poor lighting — all known contributors to accidents. In other words, the model is capturing a real-world causal relationship, not something arbitrary.
From Prediction to Decision-Making: This analysis moves beyond "which city is risky" to why is the city risky, which factors are driving that risk, and whether these factors are structural or situational. Traffic density may require infrastructure or routing solutions; visibility-related risks may require operational adjustments (timing, safety protocols).
Conclusion of this section: Terno AI's predictive system is capable of both generalizing to unseen cities and providing interpretable, factor-level insights. Because visibility and traffic density are actionable factors, the model can directly inform operational and strategic decisions — shifting delivery platforms from asking "Which city should we enter?" to "Under what conditions can we operate safely in that city?" This shift — from location-based to condition-based decision-making — is where the real value of the system lies.
6. Implications for Business Strategy
The integration of predictive risk modeling into location strategy enables several practical applications:
City Prioritization: Cities can be ranked not only by demand but also by operational risk, allowing more informed expansion decisions.
Scenario Analysis: Businesses can simulate conditions such as peak hours or adverse weather to evaluate how risk levels change dynamically.
Targeted Interventions: Identifying key drivers of risk (e.g., low visibility or high congestion) allows for localized mitigation strategies.
For example, a city like Bangalore — identified as high-risk — may still be commercially attractive but would require additional safety investments and operational safeguards. Conversely, a city like Delhi may offer a more stable entry point due to relatively lower predicted risk.
Strategic Recommendations
Incorporate risk_score as a core performance metric, alongside delivery time and cost
Integrate risk-aware routing mechanisms into dispatch algorithms
Regularly update models with new traffic, weather, and accident data
Use scenario-based simulations to guide operational planning
These steps can help shift the focus from purely efficiency-driven logistics to a more balanced, safety-aware system.
7. Future Directions and Scope of the Study
7.1 Future Directions
Building on the dominance of variables such as visibility and traffic density, several future directions can further strengthen the system:
- Real-Time Data Integration — live traffic APIs, dynamic weather feeds, and GPS-based tracking would enable adaptive risk prediction systems capable of dynamically adjusting routes and schedules (Zhang et al., 2022; Chen et al., 2021; Li et al., 2020).
- High-Resolution Temporal and Spatial Data — minute-level timestamps, seasonal variations, and micro-location clustering would allow detection of micro-risk patterns (Wang & Kwan, 2021; Yuan et al., 2019; Zheng et al., 2014).
- Expanded Social and Behavioral Risk Dimension — structured data on customer complaints, fraud patterns, and misallegations, since gig workers are often exposed to unfair ratings and reputational penalties that can indirectly increase unsafe behaviors (Rosenblat, 2018; Dubal, 2020; Wood et al., 2019; Gandini, 2019).
- Explainable AI (XAI) and Causal Inference — SHAP-based causal analysis or structural models to move from correlation to causal understanding of risk drivers (Pearl, 2019; Lundberg & Lee, 2017; Molnar, 2020).
- Scenario-Based Simulation — since the model is condition-driven, simulated inputs (e.g., peak-hour + low visibility + high traffic) can test policy interventions like increasing delivery time buffers, restricting operations during high-risk conditions, or incentivizing safer delivery practices (Nagel & Schreckenberg, 1992; Barceló, 2010).
7.2 Scope and Practical Applications
- Market Entry Strategy for Startups and SMEs — a pre-deployment decision tool evaluating cities based on underlying risk conditions rather than static metrics, enabling evidence-based market selection.
- City-Specific Delivery Optimization — since risk is condition-dependent rather than city-dependent, companies can adjust delivery timelines dynamically, optimize routing based on risk factors, and avoid high-risk operational windows.
- Factor-Level Risk Monitoring and Intervention — comparing cities across contributing factors (e.g., visibility issues vs. traffic congestion) enables targeted interventions like improved lighting or optimized routing in high-traffic zones.
- Workforce Safety and Well-being — platforms can design safer delivery schedules, avoid peak high-risk combinations (e.g., fog + traffic), and implement safety protocols during adverse conditions.
- Sales and Demand Strategy Optimization — aligning demand generation with safety by avoiding promotions during high-risk scenarios and shifting demand to low-risk time windows.
- Platform Design and Algorithmic Improvements — embedding insights from feature importance into risk-aware routing systems, dynamic pricing based on risk exposure, and safety-weighted performance metrics.
- Policy and Urban Planning Applications — helping policymakers identify high-risk urban conditions, improve infrastructure (lighting, traffic systems), and regulate delivery practices during unsafe conditions.
- Insurance and Risk Management — enabling insurance providers to develop dynamic, risk-based pricing, identify high-risk operational environments, and detect fraudulent claims.
7.3 Concluding Scope Insight
This study demonstrates that delivery risk is fundamentally multi-dimensional and condition-driven, shaped primarily by environmental and operational factors such as visibility and traffic density. By combining predictive modeling, feature importance analysis, and city-level factor comparison, the framework enables a shift from static, location-based decision-making to dynamic, condition-aware strategy design — improving operational efficiency while supporting safer, more ethical delivery systems and contributing to the long-term sustainability of the gig economy.
References
This investigation draws on a broad body of research spanning gig economy labor dynamics, transportation and urban systems, machine learning interpretability, and platform governance, including works by Useche et al. (2025), Christie et al. (2019), Gupta (2025), Nishtha R. (2025), Rosenblat (2018), Dubal (2020), Wood et al. (2019), Kellogg et al. (2020), Pearl (2019), Lundberg & Lee (2017), and reports from the International Labour Organization, World Bank, and OECD, among others. A full reference list is available in the original whitepaper.
Find the full chat links here:
https://rishovmuu.app.terno.ai/chat/10fc2227-c71e-4d4f-93db-6a3d3155ce57
https://rishovmuu.app.terno.ai/chat/share/b5084429-ce6f-45bb-87d1-b3bbe403ed81?ui_version=v2
Read the full white paper here

18 August 2026
The Honest Number Was 83%: Leakage, Abstention, and a Complaint Router You Can Actually Deploy
The same complaint-routing model scores 96.3% or 83.2% depending on which three columns you leave in the training data. The high number is the intake form being read back to you. This is what the leakage audit found before a single model was trained, why 83.2% is the honest figure, and how the same model — given permission to say "I don't know" — becomes deployable at 90.7% accuracy on 79.5% of traffic.

29 July 2026
EdgeGuard: AI-Driven Predictive Maintenance for Power Transformers
Power transformers are among the most critical assets in electrical distribution infrastructure. Their unexpected failure can result in power outages, safety hazards, equipment damage, expensive repairs, and long service interruptions. Traditional transformer maintenance practices often rely on periodic manual inspection, offline testing, or run-to-failure maintenance. These methods are expensive, slow, labor-intensive, and unable to detect rapidly developing faults in real time. EdgeGuard is an AI-driven, edge-computing predictive maintenance system designed to continuously monitor transformer health and forecast failures before catastrophic damage occurs. The system acts as a retrofittable “Digital Doctor” for distribution transformers by combining low-cost industrial sensors, an ESP32 microcontroller, local intelligence, machine learning-based risk prediction, autonomous relay control, and a real-time web dashboard. The proposed system monitors six major transformer health indicators: temperature, humidity, vibration, oil level, current, and voltage. These signals are normalized and processed through a Multi-Layer Perceptron neural network to classify transformer condition and estimate failure risk. If the predicted risk crosses a critical threshold of 80%, EdgeGuard automatically triggers a relay through GPIO 26 to isolate the transformer from the electrical network. The system also supports secure remote control, dashboard monitoring, API-key-based hardware authentication, JWT-based user access, WebSocket live updates, and automatic live-hardware detection. With an estimated deployment cost of approximately ₹3,850, EdgeGuard offers a low-cost alternative to conventional transformer monitoring systems. Its cloud-independent operation and edge-based decision-making make it especially useful for rural and semi-urban distribution grids where connectivity and maintenance resources are limited.

28 July 2026
ANALYZING TOXIC USER BEHAVIOR AND RISK PATTERNS IN ONLINE GAMING PLATFORMS
This study shows that behavioral data alone can't reliably predict gaming toxicity — but a risk-based model combining behavioral and engineered features does a much better job of flagging the small segment of high-risk users driving disproportionate harm.