Can You Predict a Tool Failure Before It Happens? A Data-Driven Look at CNC Machining Breakdowns
Unplanned tool failures are one of the most expensive problems in manufacturing. A single unexpected breakdown can halt production, spike scrap rates, and send maintenance costs climbing — and traditional time-based maintenance schedules aren't built to catch it. Tools get replaced either too early (wasting good tool life) or too late (after the damage is done).
A recent case study set out to fix this by analyzing 10,000 real CNC machining records — sensor readings, operational metrics, and failure outcomes — to find out what actually predicts a failure before it happens. The result is a set of concrete operating thresholds, product-specific maintenance rules, and a tuned machine learning model that catches failures with 98.4% accuracy.
Here's what the analysis found.
The Problem: Reactive Maintenance Costs More Than It Saves
Modern manufacturing depends on continuous machine operation and reliable tool performance. When a tool or machine fails unexpectedly, the consequences ripple outward: unplanned downtime, higher scrap rates, and rising maintenance costs.
The goal of this study was straightforward: predict imminent machine or tool failures using operational sensor data — before the failure occurs — by identifying early warning patterns in temperature, torque, rotational speed, and tool wear.
This matters to more than just the maintenance team. Operations teams benefit from better uptime and throughput, maintenance engineers get clearer prioritization for their work, and plant management sees lower costs and improved Overall Equipment Effectiveness (OEE).
The Data
The study used an industrial dataset of 10,000 machining operation records, each capturing:
Numerical features: Air Temperature, Process Temperature, Rotational Speed, Torque, Tool Wear
Categorical features: Product ID, Type (Light/Medium/Heavy duty), Failure Type
Target variable: Binary failure indicator (0 = No failure, 1 = Failure)
The analysis moved through five structured phases: data exploration, EDA and key insights, interaction/threshold analysis, product-type segmentation, and finally predictive modeling. The dataset was split using a stratified 80/20 partition — 8,000 training records and 2,000 validation records — preserving the class imbalance ratio in both sets.
Exploratory Data Analysis: What Actually Drives a Failure
Failures Are Rare — But That Makes Detection Harder, Not Easier
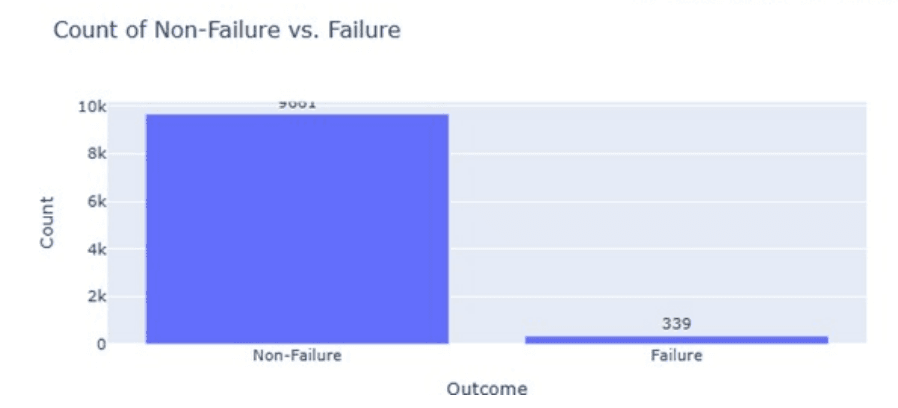
Out of 10,000 records, only about 3.4% were actual failures (339 out of 9,671+339). That's a strong class imbalance, and it matters: a model that just predicts "no failure" every time would already be right 96.6% of the time — while missing every single real failure. This is exactly why the study leans on precision and recall, not just raw accuracy, to judge model performance later on.
Tool Wear Is the Single Strongest Predictor
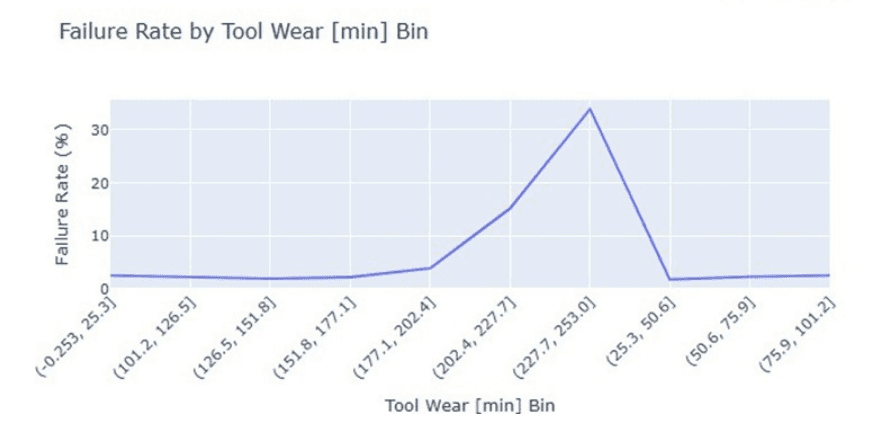
Failure probability stays low and flat at lower wear levels — but climbs sharply once tool wear crosses roughly 100 minutes. Beyond that point, the likelihood of failure rises rapidly. This confirms tool degradation as a dominant driver of failure, and points to the 80–100 minute range as the ideal window for preventive inspection or replacement.
Torque and Speed Compound the Risk
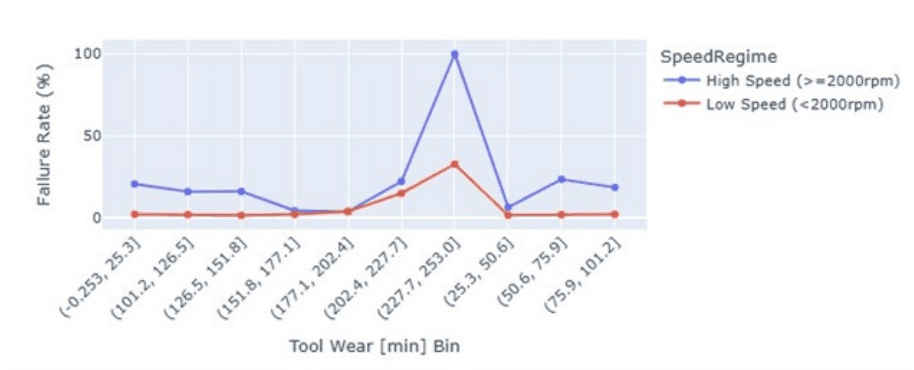
Failure cases consistently show higher torque and higher rotational speed than non-failure cases. Worn tools operating under high mechanical load are especially vulnerable — excessive torque combined with high spindle speed adds stress to already-aging tools and accelerates breakdown.
A Small Temperature Rise Is a Big Warning Sign
Process temperature in failure cases runs consistently 2–3 K higher than in non-failure cases. It's a small shift, but it's systematic — a sign of reduced heat dissipation efficiency, usually caused by tool wear or excessive load. That consistency makes process temperature a useful early-warning signal in its own right.
The Real Danger Zone: When Risk Factors Combine
A critical failure-prone condition emerges when these three factors occur together:
Tool wear exceeding 100 minutes
Torque above 45 Nm
Process temperature above 312 K
When all three line up simultaneously, failure risk increases substantially — far more than any single factor alone would suggest. This is the core insight that shapes the maintenance rules below: combined-threshold monitoring beats single-metric monitoring.
Interaction & Threshold Analysis: Defining Safe vs. High-Risk Zones
Based on the interaction analysis, two clear operating regimes emerged:
Safe Operating Conditions:
Tool wear below 80 minutes
Torque below 40 Nm
Speed below 2,000 rpm
Process temperature below 310 K
High-Risk Operating Conditions:
Tool wear above 120 minutes
Torque above 50 Nm
High speed with worn tools
Process temperature above 312 K
Practical Maintenance Rules
From this, five concrete rules emerged for condition-based maintenance:
- Replace tools before wear exceeds 80 minutes
- Plan earlier replacement if torque rises above 45 Nm
- Avoid speeds ≥ 2,000 rpm once wear exceeds 100 minutes
- Take immediate action if process temperature exceeds 312 K with moderate-to-high wear
- Trigger alerts when two or more risk conditions occur together
Product Type Comparison: One Size Doesn't Fit All
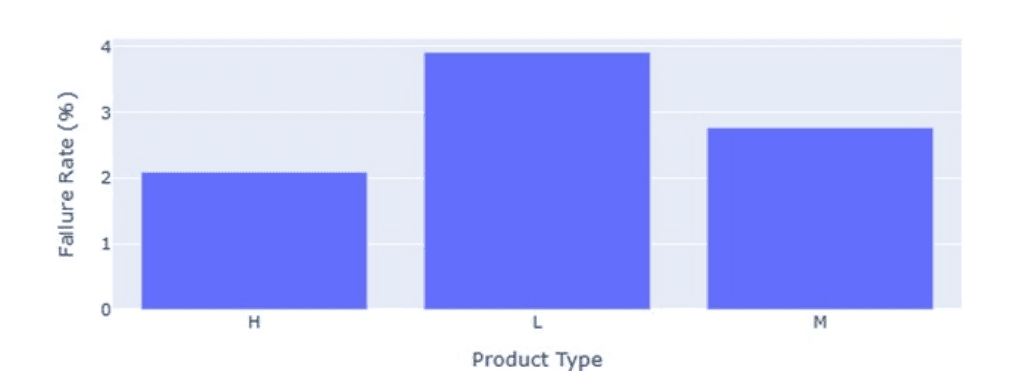
The three product types (Light, Medium, Heavy duty) show meaningfully different failure behavior:
Type L: Highest failure rate (3.9%) — driven by longer tool usage combined with slightly higher torque, resulting in cumulative fatigue
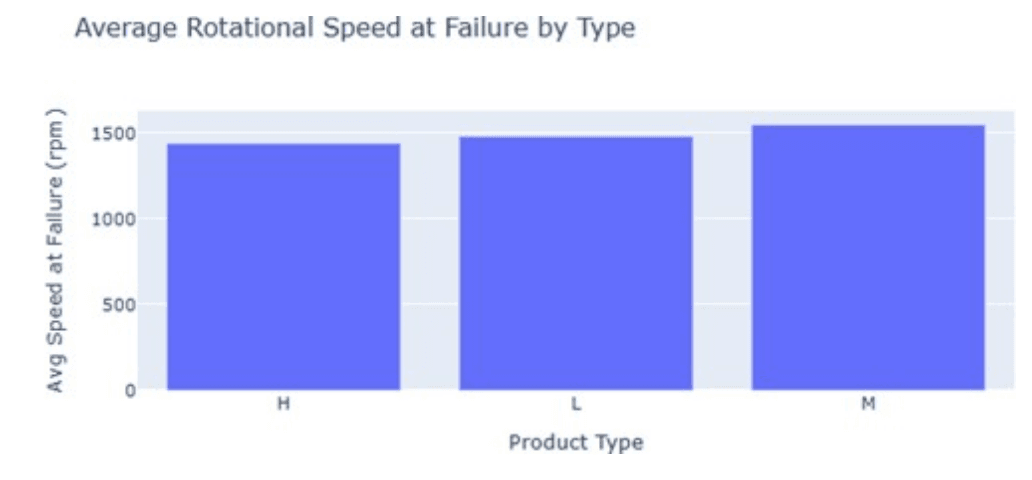
Type M: Moderate failure rate (2.8%) — higher rotational speed is the dominant factor, causing earlier failures
Type H: Lowest failure rate (2.1%) — balanced operating conditions lead to stable performance
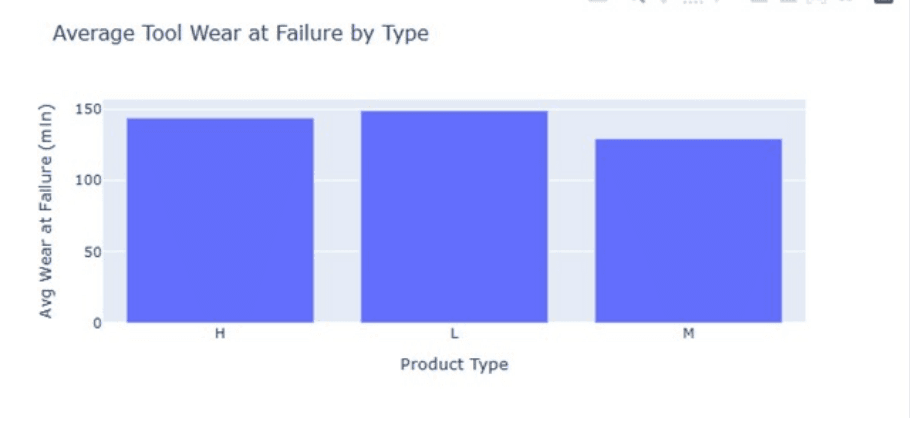
Key insight: Type M tools fail earlier but less often; Type L tools fail more often overall due to accumulated wear and load. These are genuinely different failure modes — not just different failure rates — which is why a one-size-fits-all maintenance policy falls short.
Watch Out for These Misleading Conclusions
Looking at product-type charts in isolation can be deceiving:
Type L's higher failure rate might suggest faster degradation — but the data show these tools actually fail after longer usage, just under heavier load.
Type M's lower failure rate might look "safer" at first glance — but when Type M tools do fail, they fail much earlier and at higher speeds.
Judging tool wear or failure rate alone masks the real operational profile; speed and torque disproportionately affect Type M tool life.
Operator-Level Daily Guidance
Type L (Load-Heavy Operations): Replace tools around 140 minutes of wear; watch closely for sudden torque increases.
Type M (High-Speed Operations): Reduce speed as tools approach 100 minutes of wear, or replace earlier to avoid sudden failures above 2,000 rpm.
Type H (Standard Operations): Apply standard rules — replace around 120 minutes with routine torque and temperature monitoring.
Predictive Modeling: From Thresholds to Machine Learning
Rule-based thresholds are useful, but the study went further — building a machine learning classifier to predict failure probability directly from the sensor data.
Baseline: Logistic Regression Falls Short
Logistic Regression was tested first for its simplicity and interpretability:
Accuracy: 96.9%
Precision: 66.7%
Recall: 14.7%
F1-Score: 24.1%
The accuracy number looks strong — but it's misleading. With recall at just 14.7%, the model misses the vast majority of actual failures. Its high accuracy comes from correctly predicting the dominant "no failure" class, not from genuinely detecting failures. This demonstrated that linear models simply aren't suited to this imbalanced, non-linear problem.
Random Forest: A Meaningful Jump in Performance
A Random Forest classifier was introduced next, better suited to capturing non-linear relationships and interactions between operational variables.
Unbalanced Random Forest:
- Accuracy: 98.2% | Precision: 87.8% | Recall: 52.9% | F1-Score: 66.1%
Balanced Random Forest (class-weight balancing):
- Accuracy: 98.1% | Precision: 94.1% | Recall: 47.1% | F1-Score: 62.7%
Balancing traded some recall for higher precision — useful context depending on what a business values more: catching every possible failure (recall) or avoiding false alarms (precision).
Hyperparameter Tuning Pushes Performance Further
Using GridSearchCV with three-fold cross-validation, optimized for F1-score, the best configuration was found to be:
n_estimators: 200
max_depth: None
min_samples_leaf: 1
Tuned Model Performance:
Accuracy: 98.4%
Precision: 92.7%
Recall: 55.9%
F1-Score: 69.7%
Model Comparison
| Model | Accuracy | Precision | Recall | F1-Score |
|---|---|---|---|---|
| Logistic Regression | 96.9% | 66.7% | 14.7% | 24.1% |
| Random Forest (Unbalanced) | 98.2% | 87.8% | 52.9% | 66.1% |
| Random Forest (Balanced) | 98.1% | 94.1% | 47.1% | 62.7% |
| Random Forest (Tuned) | 98.4% | 92.7% | 55.9% | 69.7% |
Production recommendation: The tuned Random Forest model is the preferred choice for deployment. Even a limited, carefully constrained hyperparameter search meaningfully improved results, striking the best balance between precision and recall while staying robust and generalizable. The right choice between Random Forest variants ultimately depends on operational priorities — favor higher recall if missed failures are more costly, or higher precision if false alarms are more disruptive to production.
Recommendations: Turning Insight Into Action
1. Condition-Based Tool Replacement
Tool wear is the strongest single predictor of failure, and risk rises dramatically past the 100-minute mark.
Replace tools before wear exceeds 80 minutes
Install tool wear sensors with automated alerts at 80% of maximum safe wear
Apply product-type-specific schedules: Type L at ~140 min, Type M at ~100 min, Type H at ~120 min
2. Multi-Parameter Threshold Monitoring
No single parameter is sufficient on its own — combined triggers (torque + temperature + wear) predict failure far more reliably than isolated indicators.
Deploy real-time dashboards tracking torque, rotational speed, and process temperature together
Trigger alerts whenever two or more risk thresholds are breached concurrently
Flag readings above 312 K combined with moderate tool wear as an early-warning layer
3. Predictive Intervention System
With 98.4% accuracy and a 69.7% F1-score, the tuned Random Forest model can flag at-risk operations before failure occurs.
Integrate the model into SCADA or MES systems for continuous, real-time failure probability scoring
Automatically notify maintenance engineers and flag machines for inspection when failure probability exceeds 0.7
Retrain the model quarterly as tool batches and process conditions evolve
Projected impact: Proactive intervention based on these findings could prevent an estimated 15–20% of forecasted failure events from materializing — directly reducing unplanned downtime and scrap costs.
Limitations
The analysis assumes accurate and stable sensor measurements; transient operating conditions or material/tooling variation could shift results. The thresholds identified here are specific to this dataset and may need adjustment in different production environments. The model also doesn't currently account for batch-to-batch raw material variation or differences between tool suppliers, both of which could shift critical wear thresholds. Any real-world deployment should include a validation phase against live production data before full rollout.
Key Takeaways
- Tool wear beyond ~100 minutes is the clearest single warning sign of impending failure.
- Combined risk factors matter more than any single metric — high torque, high speed, and elevated temperature together dramatically raise failure risk once wear crosses critical levels.
- Product type changes the maintenance story. Type L fails more often overall; Type M fails less often but earlier and more suddenly; Type H is the most stable. A uniform maintenance policy misses this nuance.
- Accuracy alone is a misleading metric for imbalanced problems. Logistic Regression's 96.9% accuracy masked a recall of just 14.7% — meaning it missed most real failures.
- Random Forest, tuned properly, delivers a genuinely usable model — 98.4% accuracy and a 69.7% F1-score, balancing precision and recall well enough for production use.
- Condition-based maintenance beats fixed schedules. Monitoring real sensor thresholds — rather than replacing tools on a calendar — enables earlier, more targeted intervention.
Why This Matters
This study is a good example of how far you can get with standard sensor data, the right feature framing, and a properly tuned model — no exotic instrumentation required. The combination of interpretable threshold rules (useful for operators on the shop floor right now) and a deployable machine learning model (useful for systems-level automation) gives manufacturers a practical, layered path from insight to action: start with the maintenance rules today, and build toward real-time predictive scoring as infrastructure allows.
Read the full white paper here

18 August 2026
The Honest Number Was 83%: Leakage, Abstention, and a Complaint Router You Can Actually Deploy
The same complaint-routing model scores 96.3% or 83.2% depending on which three columns you leave in the training data. The high number is the intake form being read back to you. This is what the leakage audit found before a single model was trained, why 83.2% is the honest figure, and how the same model — given permission to say "I don't know" — becomes deployable at 90.7% accuracy on 79.5% of traffic.

29 July 2026
EdgeGuard: AI-Driven Predictive Maintenance for Power Transformers
Power transformers are among the most critical assets in electrical distribution infrastructure. Their unexpected failure can result in power outages, safety hazards, equipment damage, expensive repairs, and long service interruptions. Traditional transformer maintenance practices often rely on periodic manual inspection, offline testing, or run-to-failure maintenance. These methods are expensive, slow, labor-intensive, and unable to detect rapidly developing faults in real time. EdgeGuard is an AI-driven, edge-computing predictive maintenance system designed to continuously monitor transformer health and forecast failures before catastrophic damage occurs. The system acts as a retrofittable “Digital Doctor” for distribution transformers by combining low-cost industrial sensors, an ESP32 microcontroller, local intelligence, machine learning-based risk prediction, autonomous relay control, and a real-time web dashboard. The proposed system monitors six major transformer health indicators: temperature, humidity, vibration, oil level, current, and voltage. These signals are normalized and processed through a Multi-Layer Perceptron neural network to classify transformer condition and estimate failure risk. If the predicted risk crosses a critical threshold of 80%, EdgeGuard automatically triggers a relay through GPIO 26 to isolate the transformer from the electrical network. The system also supports secure remote control, dashboard monitoring, API-key-based hardware authentication, JWT-based user access, WebSocket live updates, and automatic live-hardware detection. With an estimated deployment cost of approximately ₹3,850, EdgeGuard offers a low-cost alternative to conventional transformer monitoring systems. Its cloud-independent operation and edge-based decision-making make it especially useful for rural and semi-urban distribution grids where connectivity and maintenance resources are limited.

28 July 2026
ANALYZING TOXIC USER BEHAVIOR AND RISK PATTERNS IN ONLINE GAMING PLATFORMS
This study shows that behavioral data alone can't reliably predict gaming toxicity — but a risk-based model combining behavioral and engineered features does a much better job of flagging the small segment of high-risk users driving disproportionate harm.