
1. Executive Summary
Hotel networks worldwide experience substantial revenue losses from last-minute reservation cancellations, leading to unoccupied rooms, inefficient inventory management, and degraded financial performance. This white paper presents a comprehensive data-driven approach to predicting booking cancellations and translating those predictions into actionable revenue management strategies.
Core Finding: Approximately 37.1% of all reservations in the dataset are canceled—a rate high enough to represent a systemic operational challenge. Using a tuned Random Forest classifier, this study achieves an F1-score of 0.718 and a recall of 69.4% for cancellation detection, enabling hotels to proactively intervene before revenue is lost.
Principal Achievements:
Identified
lead_timeas the strongest single predictor of cancellation risk (correlation: 0.29)Established distinct cancellation risk profiles across market segments (Groups: 61%, Online TA: 37%, Direct: 15%)
Demonstrated that historical customer behavior (
previous_cancellations) is a reliable forward-looking indicatorDeveloped and evaluated three classification models: Logistic Regression, Random Forest, and XGBoost
Recommended Random Forest as the production model, offering the best balance of precision (74.5%) and recall (69.4%)
Formulated five concrete business strategies including dynamic deposit policies, model-driven overbooking, and customer segmentation
2. Introduction & Problem Statement
2.1 Introduction
Modern hotel operations depend on accurate occupancy forecasting to maximize revenue per available room (RevPAR) and maintain operational efficiency. Reservation cancellations—particularly those occurring close to arrival—disrupt inventory planning, inflate operational costs, and erode profitability. Traditional approaches to managing cancellation risk rely on fixed deposit policies and heuristic overbooking rules that fail to account for the heterogeneity of guest behavior across segments, channels, and booking patterns.
This study demonstrates how machine learning, applied to historical booking data, can provide the predictive foundation for dynamic, segment-aware revenue management strategies. The analysis proceeds from raw data exploration through feature engineering, model development, and practical business recommendation.
2.2 Problem Statement
The hotel network under analysis faces a dual challenge: (1) reservation cancellations reduce effective room utilization, and (2) existing flat-rate policies fail to differentiate between low-risk and high-risk bookings. The consequences are twofold—either excessive revenue loss from unoccupied rooms, or excessive guest friction from overly restrictive policies applied indiscriminately.
Core Analytical Objective: Predict the probability of reservation cancellation for any incoming booking, using operational and behavioral features available at the time of reservation, and translate those predictions into segment-specific deposit and overbooking policies.
Business Importance: This framework enables hotels to: reduce overall and last-minute cancellation rates, minimize revenue loss through optimized deposit strategies, maximize occupancy via controlled overbooking, improve RevPAR, and enable targeted policy decisions through customer segmentation.
2.3 Stakeholders and Beneficiaries
Revenue Management Teams: Improved cancellation forecasting supports more precise pricing and inventory decisions
Front Office and Reservations Staff: Automated risk scoring supports real-time booking policy application
Hotel General Managers and Ownership: Higher occupancy rates and improved RevPAR translate directly to improved profitability
Distribution and Channel Managers: Segment-specific insights inform negotiation with OTAs and corporate clients
3. Data & Methodology
3.1 Dataset Description
The analysis is based on a publicly available hotel booking dataset containing 119,390 observations across 32 features. Each observation represents a single reservation, capturing booking details, customer demographics, financial indicators, and reservation outcomes.
Sample Size: 119,390 hotel booking records (32 columns)
Numerical Features: Lead time, Average Daily Rate (ADR), total guests, previous cancellations, previous bookings not canceled, booking changes, days in waiting list
Categorical Features: Market segment, distribution channel, customer type, deposit type, country, agent, company
Target Variable:
is_canceled— binary cancellation indicator (0 = Checked out, 1 = Canceled)
3.2 Column Descriptions
lead_time: Number of days between booking date and arrival dateadr: Average Daily Rate — mean daily revenue from room bookingsmarket_segment: Source channel (e.g., Online TA, Groups, Corporate, Direct)distribution_channel: Booking distribution method (TA/TO, Direct, GDS, Corporate)customer_type: Guest category (Transient, Transient-Party, Contract, Group)deposit_type: Deposit arrangement (No Deposit, Non Refund, Refundable)previous_cancellations: Number of prior cancellations by the guestprevious_bookings_not_canceled: Number of prior completed staysbooking_changes: Number of modifications made to the reservationis_repeated_guest: Flag indicating whether the guest has stayed beforetotal_guests: Engineered feature — sum of adults, children, and babies
3.3 Analytical Framework
The investigation proceeded through six sequential phases:
- Phase 1 — Data Quality Assessment: Missing value analysis, type verification, outlier detection
- Phase 2 — Data Cleaning and Preprocessing: Imputation, anomaly treatment, feature engineering
- Phase 3 — Univariate Analysis: Distribution profiling of key numerical and categorical variables
- Phase 4 — Bivariate and Correlation Analysis: Relationship mapping between predictors and cancellation outcome
- Phase 5 — Feature Selection and Encoding: Variable selection guided by domain knowledge and statistical analysis
- Phase 6 — Predictive Modeling: Logistic Regression baseline, Random Forest, and XGBoost development with comparative evaluation
The dataset was divided using a stratified 80/20 train-test split, yielding 95,178 training observations and 23,795 test observations. Stratified sampling preserved the original class distribution (62.9% non-canceled, 37.1% canceled) across both subsets.
4. Data Quality and Preprocessing
4.1 Missing Value Treatment
Missing values were addressed systematically:
children: Minimal missing entries imputed with zero (no children assumed)country: Missing values replaced with label "Unknown" to preserve record integrityagentandcompany: High proportion of missing values recoded as "No Agent" and "No Company" respectively, representing the absence of intermediaries
4.2 Anomaly Detection and Treatment
ADR: Negative values removed; extreme outliers capped to realistic pricing ranges
Guest counts (adults, children, babies): Unrealistic values (e.g., zero adults) filtered out to maintain logical booking consistency
Data type corrections:
agentandcompanyconverted from numeric to categorical identifiers
4.3 Feature Engineering
A composite variable total_guests was created by summing adults, children, and babies, providing a single booking-size measure. This variable captures household composition in a compact form without creating redundancy.
After all preprocessing steps, the final dataset comprised 118,973 observations and 33 features, with no remaining missing values and all features within realistic operational bounds.
5. Exploratory Data Analysis & Key Insights
5.1 Cancellation Distribution
Univariate analysis of the target variable reveals that approximately 37.1% of all reservations are canceled, while 62.9% result in successful check-outs. This relatively high cancellation rate—approaching two in every five bookings—represents a fundamental operational and financial challenge.
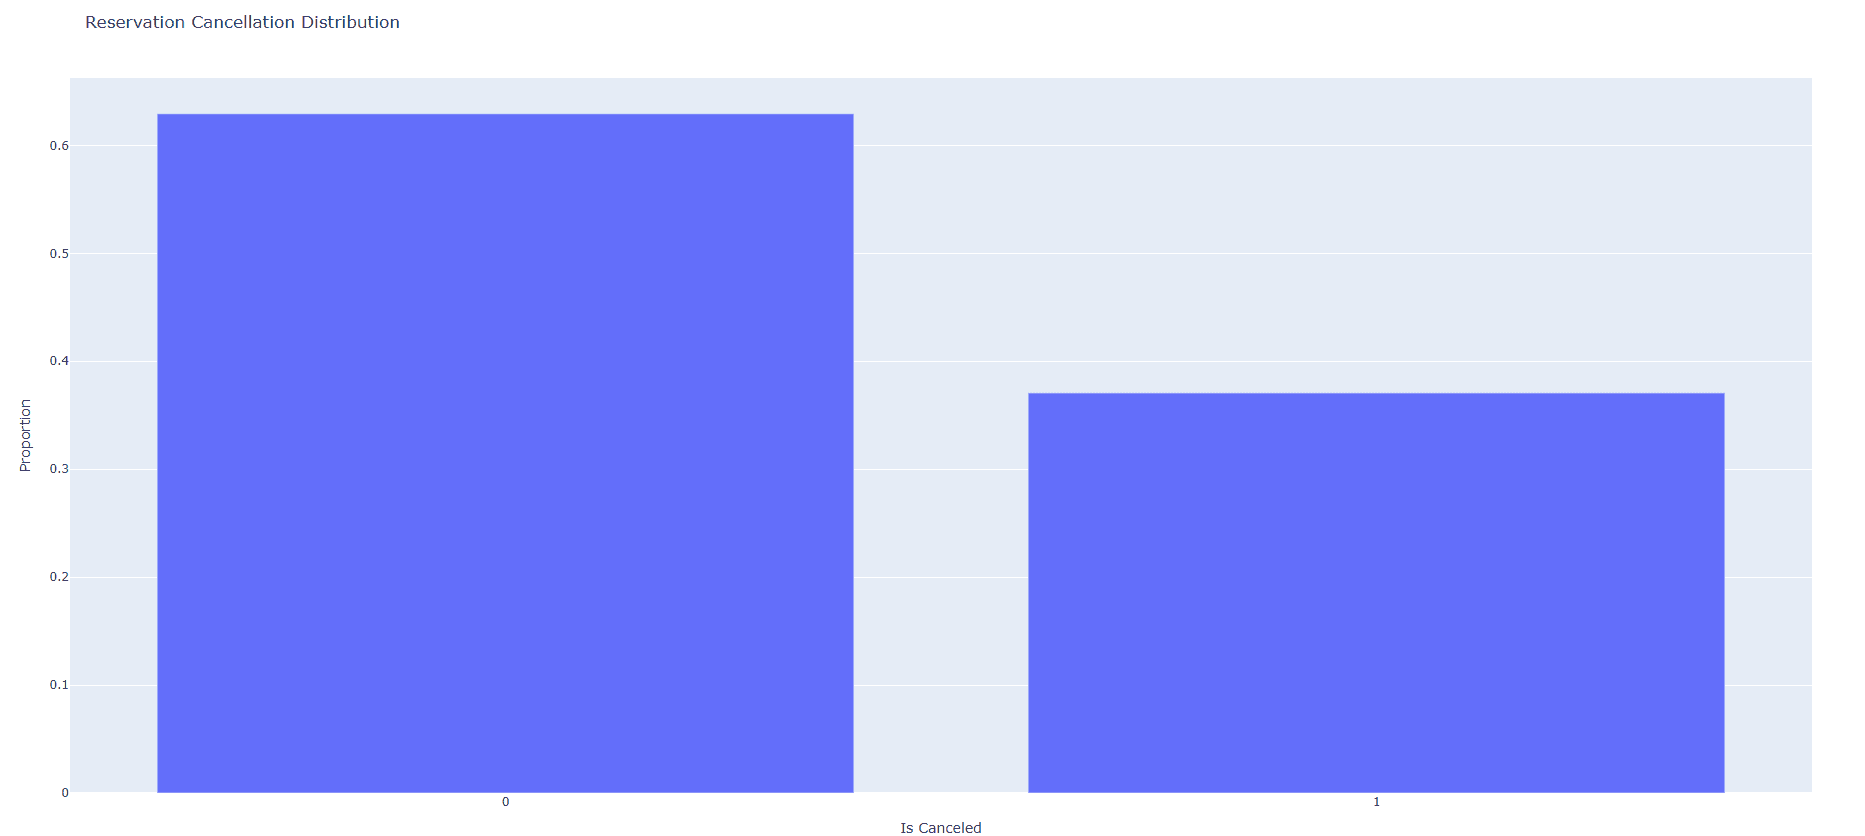
Operational Concern: Unlike the highly imbalanced failure rates seen in industrial predictive maintenance (typically 3–5%), the hotel cancellation rate of 37.1% is large enough to be structurally significant. Standard classification approaches remain useful, but performance on the positive (canceled) class must be monitored carefully.
5.2 Lead Time Distribution
The lead_time variable exhibits a highly right-skewed distribution. The mean lead time is 104 days, while the median is substantially lower at 69 days, indicating that the majority of bookings are made within a 2–3 month window. However, a long tail extending to 737 days reflects a meaningful segment of highly advance bookings.
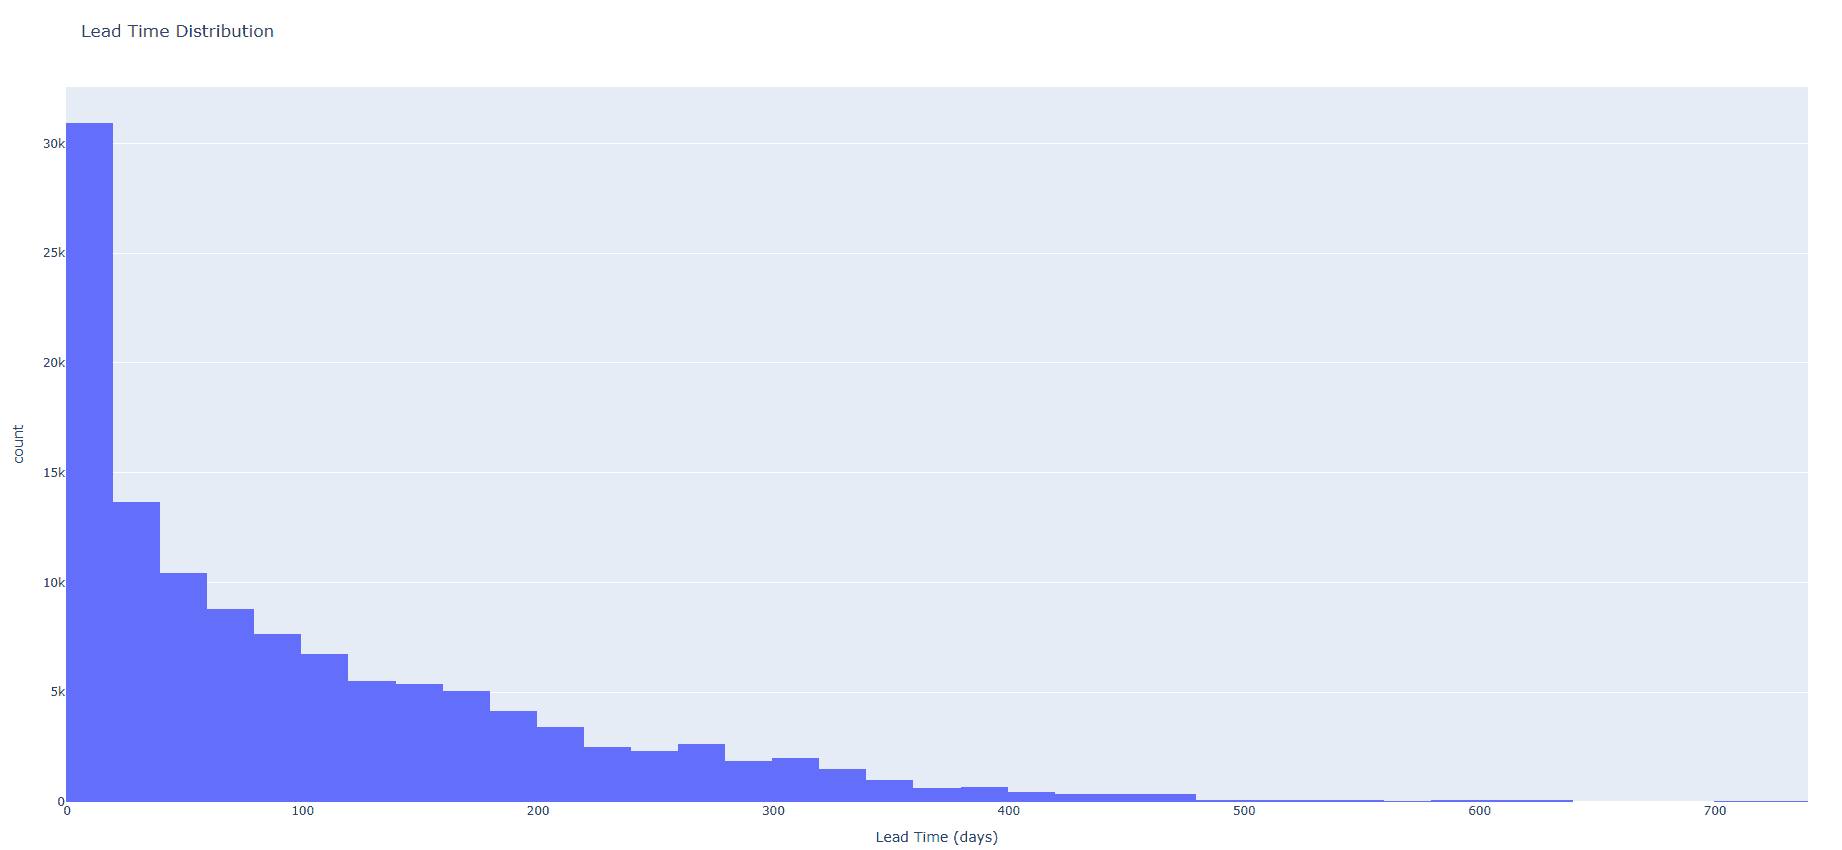
This skew is operationally important: bookings made far in advance carry inherently higher uncertainty. Behavioral commitments decay over longer time horizons, making early reservations structurally more likely to be canceled.
5.3 Cancellation Rates by Market Segment
Bivariate analysis across market segments reveals stark differences in cancellation behavior:
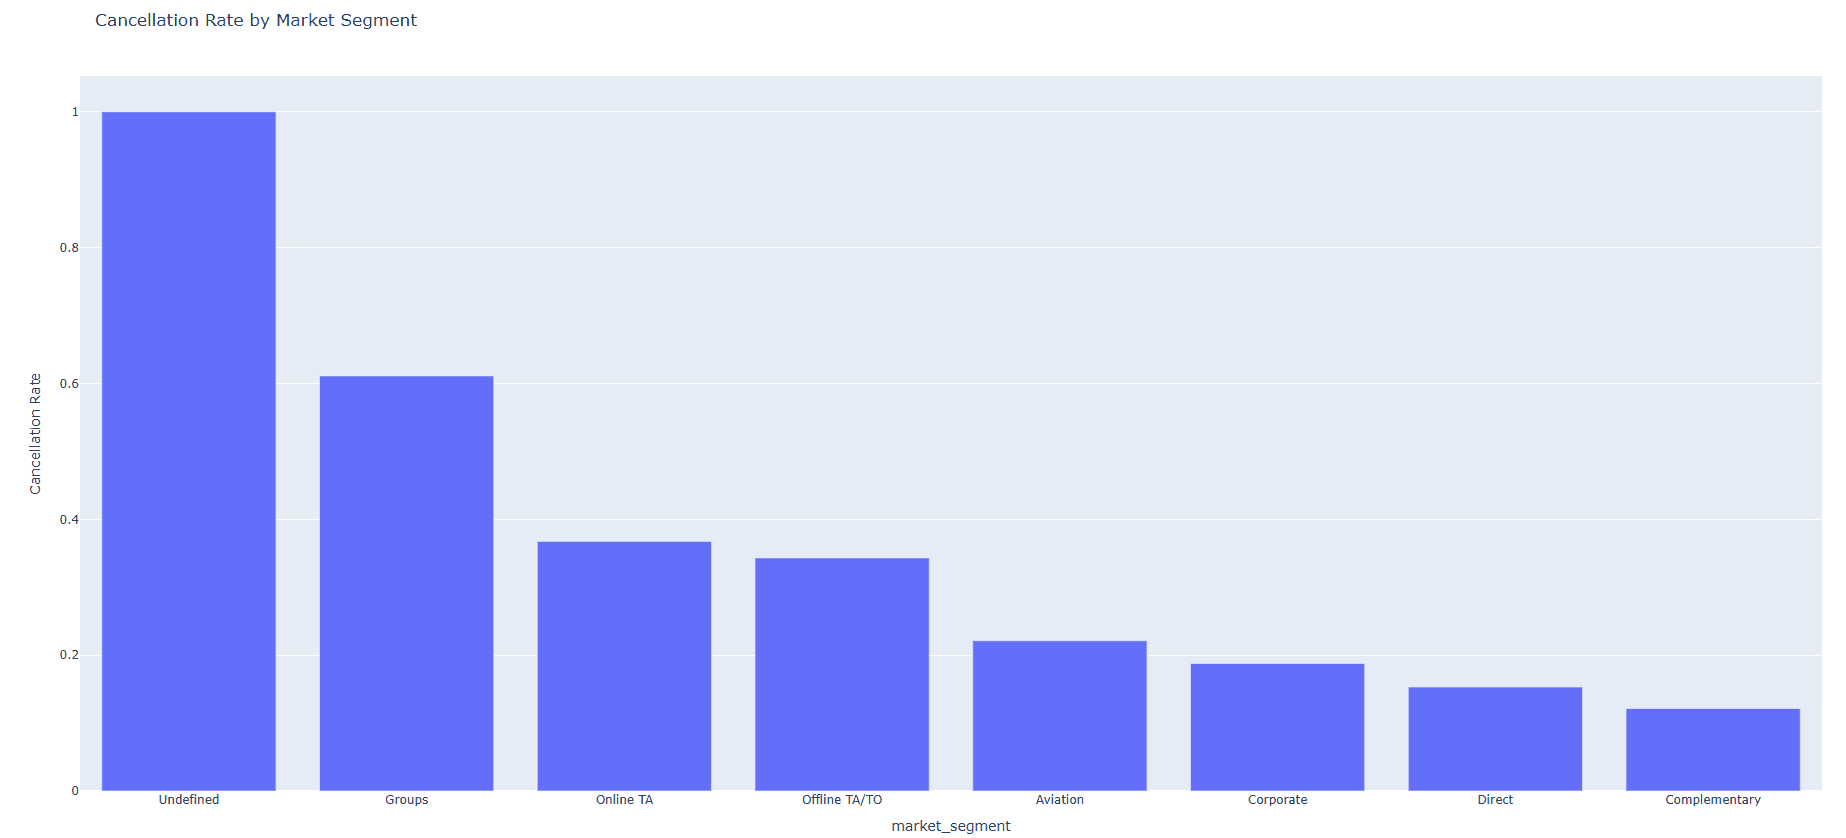
Undefined: 100% cancellation rate — likely a data artifact or placeholder; must be treated with caution
Groups: 61% cancellation rate — highest among valid segments; driven by collective booking uncertainty
Online TA: 37% — matches the overall dataset average; large volume amplifies absolute impact
Offline TA/TO: 34% — comparable risk to Online TA
Aviation: 22% — moderate risk, likely tied to flight-dependent itineraries
Corporate: 19% — relatively reliable, supported by contractual arrangements
Direct: 15% — low risk; guests booking directly tend to show higher intent
Complementary: 12% — lowest risk among all segments
5.4 Correlation Analysis
A refined correlation analysis focused on key numerical features confirms the dominant predictors:
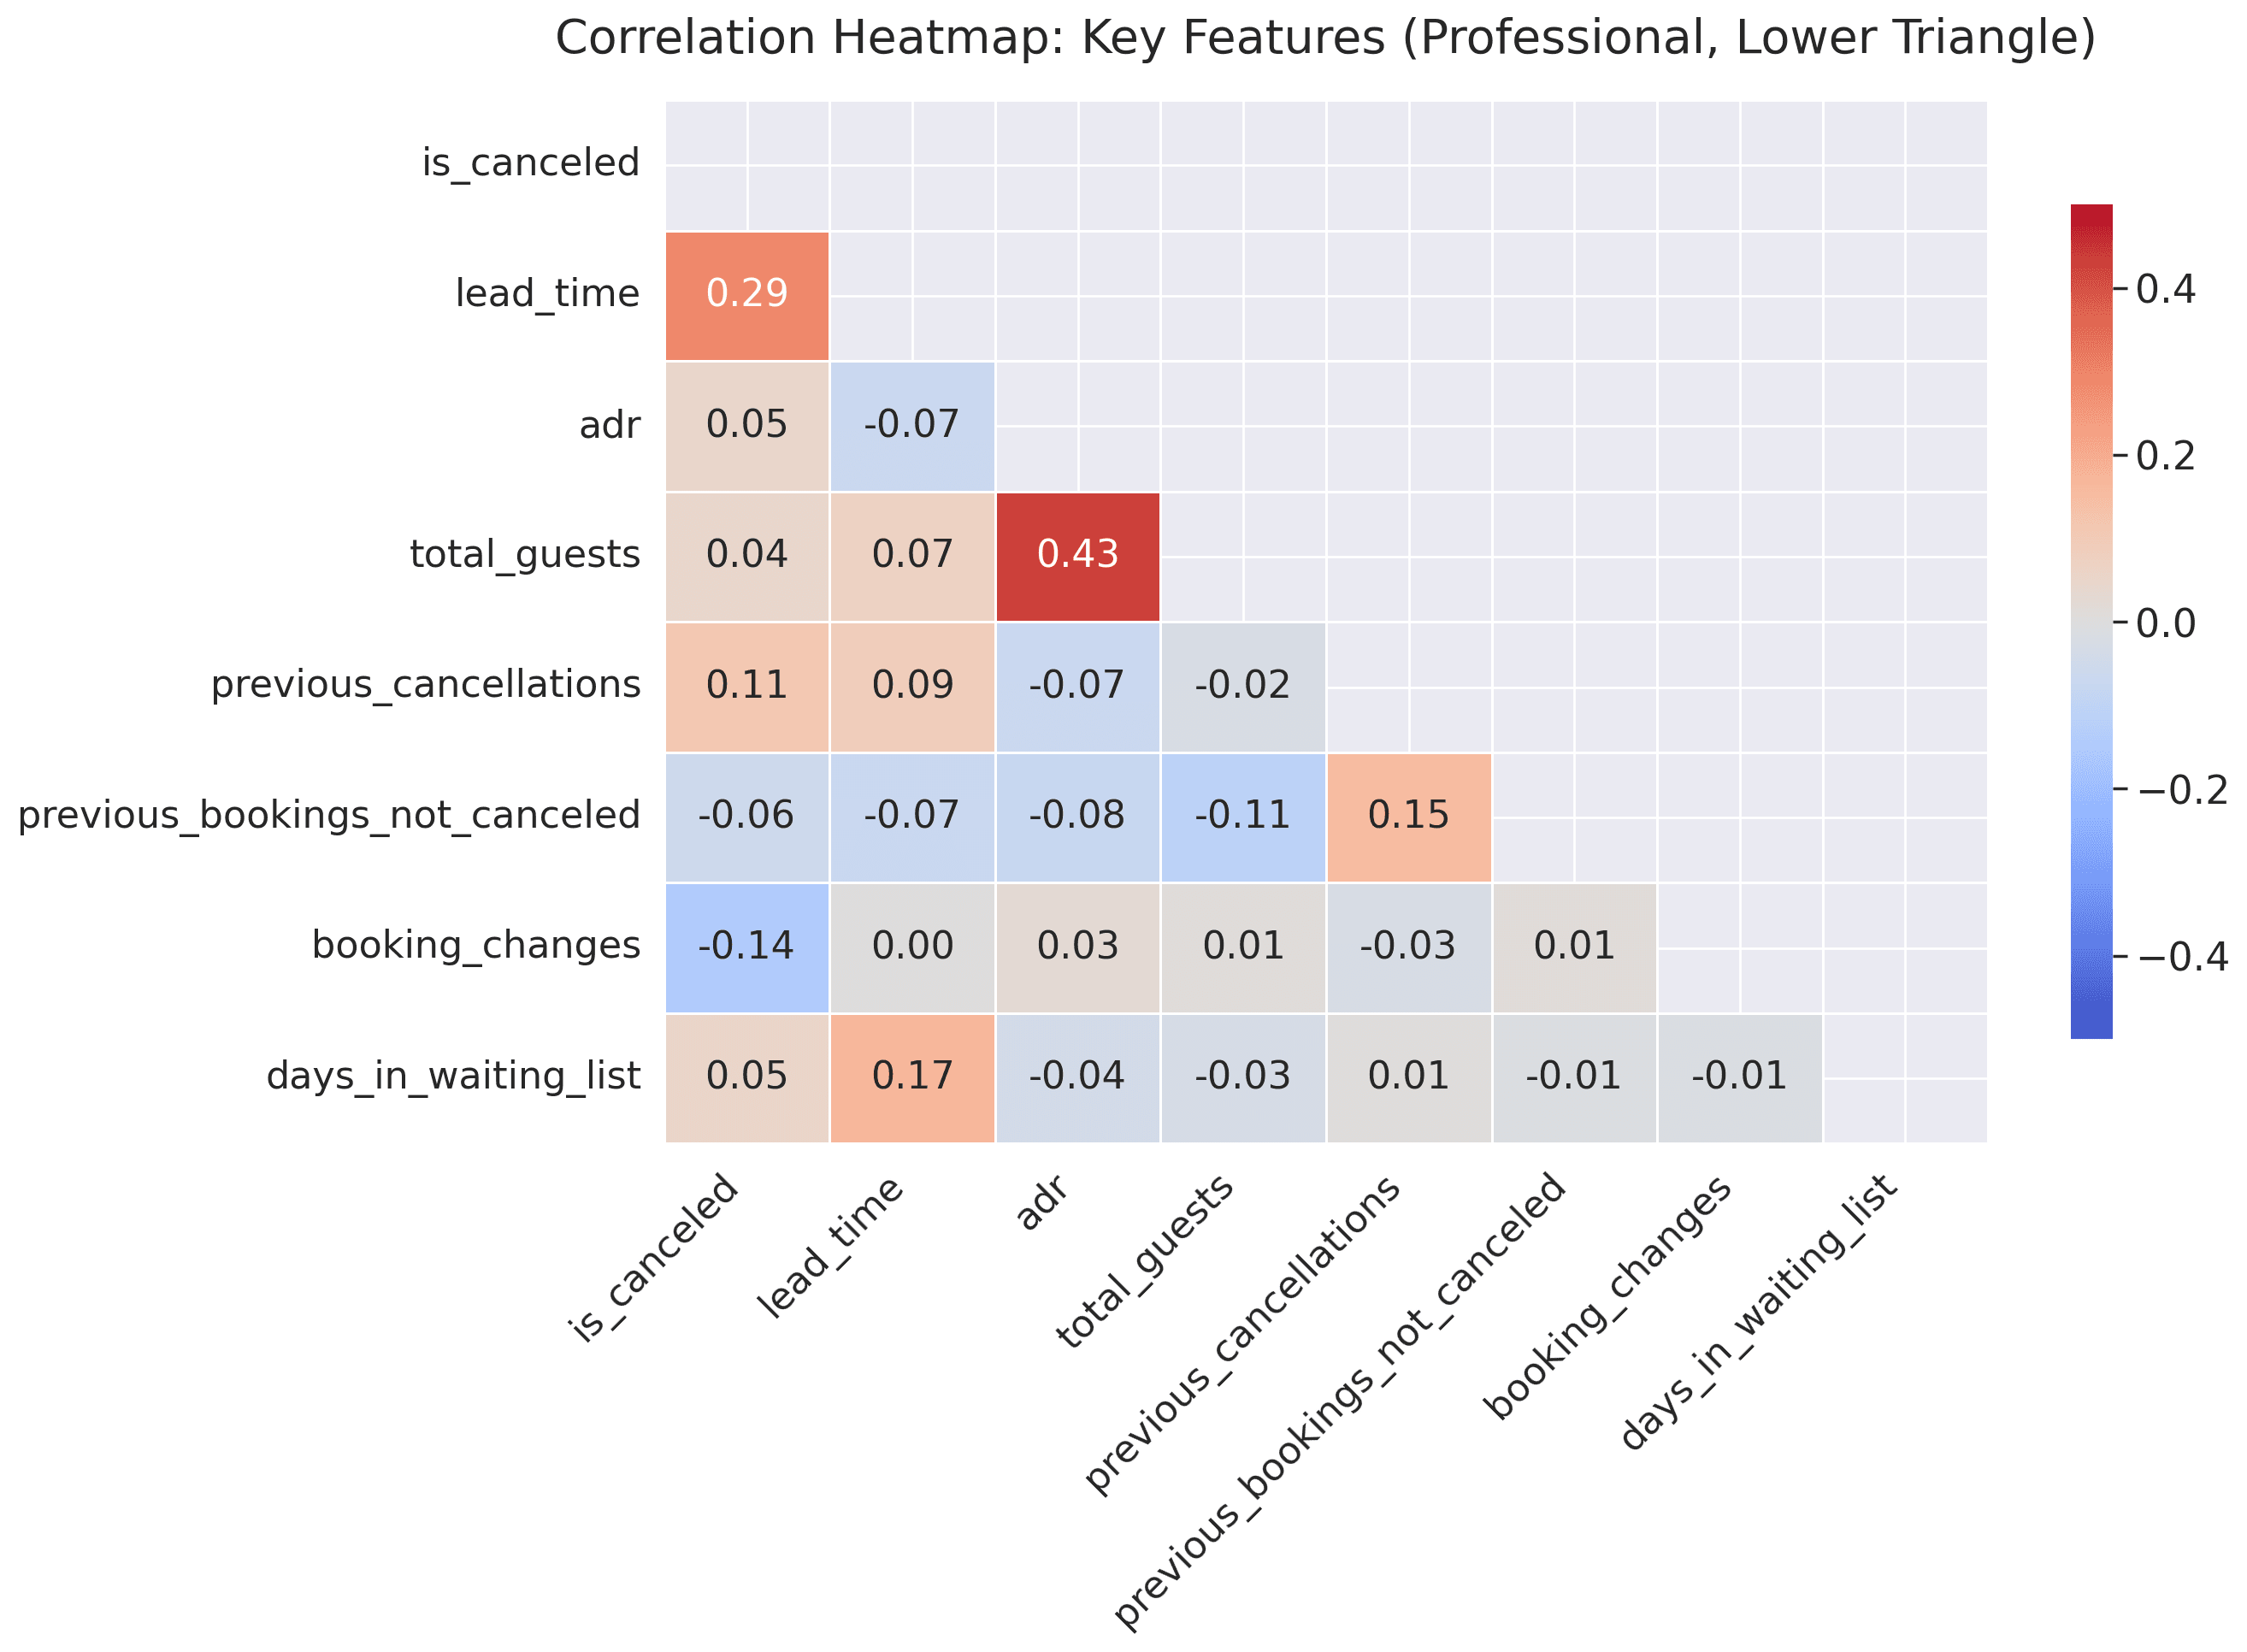
lead_time (0.29): Strongest positive correlation with cancellation — bookings made further in advance carry significantly higher cancellation risk
previous_cancellations (0.11): Historical cancellation behavior is a meaningful forward indicator — past cancelers are more likely to cancel again
booking_changes (−0.14): Negative correlation — guests who actively modify their reservations show greater commitment and are less likely to cancel
previous_bookings_not_canceled (−0.06): Loyal guests who have reliably completed prior stays are less likely to cancel future bookings
is_repeated_guest (implicit): Repeat guests demonstrate lower cancellation propensity — a loyalty signal
adr (0.05) and total_guests (0.04): Weak direct correlations; more influential when combined with other features in non-linear models
Notably, total_guests and adr exhibit a moderate inter-feature correlation (0.43), suggesting larger groups tend to attract different pricing dynamics. This does not introduce harmful multicollinearity for tree-based models.
6. Feature Selection and Model Preparation
6.1 Selected Predictive Features
A structured selection process guided by domain knowledge, correlation analysis, and leakage avoidance identified 22 features for modeling:
Booking behavior:
lead_time,booking_changes,days_in_waiting_listHistorical behavior:
previous_cancellations,previous_bookings_not_canceled,is_repeated_guestCustomer attributes:
market_segment,distribution_channel,customer_type,deposit_typeFinancial and composition:
adr,total_guests
6.2 Data Leakage Prevention
To ensure model integrity, reservation_status and reservation_status_date were explicitly excluded from the feature set. Both variables directly encode the outcome (cancellation) and would cause severe data leakage, inflating model performance metrics artificially.
6.3 Categorical Encoding
Categorical variables were transformed using one-hot encoding with the first category dropped to avoid multicollinearity. The resulting binary indicators allow machine learning models to capture segment-specific effects without imposing ordinality on nominal categories.
7. Predictive Modeling: Machine Learning Approach
7.1 Classification Formulation
Hotel booking cancellation prediction is formulated as a binary classification problem:
Input Variables (X): 22 booking, behavioral, and customer features
Output Variable (y): Binary cancellation label (0 = No cancellation, 1 = Canceled)
Learning Goal: Derive function f : X → y that generalizes to unseen bookings at the time of reservation
7.2 Baseline Model: Logistic Regression
Logistic Regression was implemented as the initial baseline classifier due to its interpretability, computational efficiency, and well-established use in binary classification tasks. An 80/20 stratified split was applied.
Baseline Performance:
Accuracy: 78.0%
Precision: 91.1%
Recall: 44.0%
F1-Score: 0.59
Although overall accuracy appears acceptable, recall for the cancellation class is critically low at 44%. The model misses over half of all actual cancellations — a significant operational liability. The high precision indicates reliability only when the model does predict a cancellation, but the systematic under-identification of risk is driven by the non-linear, interaction-dependent nature of cancellation behavior, which linear models fail to capture.
7.3 Advanced Model: Random Forest
A Random Forest Classifier was deployed as the primary model. Ensemble tree methods are well-suited to this domain as they naturally capture non-linear feature interactions, handle mixed data types, and provide built-in feature importance estimates.
Random Forest Performance:
Accuracy: 80.0%
Precision: 74.5%
Recall: 69.4%
F1-Score: 0.718
Recall improved dramatically from 44.0% to 69.4% — meaning the model now correctly identifies approximately 7 out of every 10 actual cancellations. Feature importance analysis confirmed adr and lead_time as the most influential predictors, followed by deposit_type (Non Refund) and previous_cancellations, aligning closely with the EDA findings.
7.4 Alternative Model: XGBoost
An XGBoost Classifier was evaluated as a high-performance gradient boosting alternative.
XGBoost Performance:
Accuracy: 79.5%
Precision: 84.2%
Recall: 55.0%
F1-Score: 0.665
XGBoost achieves higher precision than Random Forest but at the cost of substantially lower recall. For a hotel aiming to minimize missed cancellations (and the associated revenue loss), this trade-off is unfavorable. XGBoost may be preferable in scenarios where false positives — incorrectly flagging loyal guests — carry high relationship costs.
7.5 Model Comparison and Selection
Table 1 — Performance comparison across all evaluated models on held-out test data (stratified 80/20 split)
| Model | Accuracy | Precision | Recall | F1-Score |
|---|---|---|---|---|
| Logistic Regression | 78.0% | 91.1% | 44.0% | 0.590 |
| Random Forest | 80.0% | 74.5% | 69.4% | 0.718 |
| XGBoost | 79.5% | 84.2% | 55.0% | 0.665 |
Production Recommendation: The Random Forest model is the preferred choice for operational deployment. It delivers the highest F1-score (0.718) and the best recall (69.4%), meaning it identifies the greatest proportion of actual cancellations. For revenue protection use cases, missing a cancellation is significantly more costly than generating an occasional false positive — making recall optimization the priority.
The choice between models may be adjusted based on operational context:
If missing cancellations is most costly (high downtime, peak-season rooms) → prioritize Random Forest for higher recall
If guest experience disruption is most costly (VIP segments, long-term corporate relationships) → consider XGBoost for higher precision
If interpretability is required (regulatory or audit context) → Logistic Regression provides full transparency
8. Business Insights and Recommendations
Drawing from both exploratory analysis and machine learning outputs, five strategic recommendations are proposed to reduce cancellation-driven revenue loss and improve occupancy management.
8.1 Strategic Imperative 1: Segment-Specific Deposit Policies
Justification: Group bookings and Online TA channels exhibit cancellation rates of 61% and 37% respectively — substantially higher than direct bookings at 15%. A flat deposit policy fails to reflect these structural differences.
Implementation:
Apply non-refundable or partial-deposit policies for Group and Online TA bookings
Offer flexible deposit terms to Direct, Corporate, and Complementary segments as loyalty and conversion incentives
Integrate deposit policy selection into the booking engine based on real-time segment classification
8.2 Strategic Imperative 2: Lead-Time-Scaled Deposit Requirements
Justification: Lead time is the single strongest predictor of cancellation (correlation: 0.29). Bookings made 90+ days in advance have a mean cancellation rate nearly double that of near-term bookings.
Implementation:
Define deposit tiers: 0–30 days (no deposit), 31–90 days (partial deposit), 91+ days (full or non-refundable deposit)
Automate tier assignment within the property management system (PMS) at reservation creation
Revisit deposit requirements at 60-day and 30-day checkpoints for long lead-time bookings
8.3 Strategic Imperative 3: Model-Driven Controlled Overbooking
Justification: The Random Forest model outputs calibrated cancellation probabilities. These probabilities can directly inform overbooking limits, replacing heuristic rules with data-driven targets.
Implementation:
Real-Time Scoring: Deploy the Random Forest model in the PMS or channel management system for continuous cancellation probability calculation
Overbooking Thresholds: When average predicted cancellation probability for open bookings exceeds 0.4, allow controlled overbooking of up to 10–15%
Segment-Aware Limits: Apply higher overbooking allowances for high-cancellation channels (Groups, Online TA) and lower allowances for reliable segments (Direct, Corporate)
Model Refresh: Quarterly retraining with new booking data to adapt to seasonal demand shifts and changing guest behavior patterns
8.4 Strategic Imperative 4: Historical Behavior Flagging
Justification: Guests with prior cancellations (previous_cancellations > 0) are statistically more likely to cancel again. Conversely, repeat guests (is_repeated_guest = 1) and guests with completed prior stays are more reliable.
Implementation:
Flag high-risk returning guests (prior cancellation history) for stricter deposit terms or advance payment requirements during peak demand periods
Recognize and reward loyal guests (prior completed stays) with flexible cancellation terms as part of a retention strategy
Maintain a guest risk profile database linked to PMS guest profiles for real-time policy application
8.5 Strategic Imperative 5: High-ADR Booking Protection
Justification: High-value bookings (elevated ADR) represent disproportionate revenue concentration. Their cancellation carries amplified financial consequences compared to standard bookings.
Implementation:
Apply stricter cancellation terms (e.g., 72-hour non-refundable window) for bookings with ADR above a defined threshold (e.g., top 20th percentile)
Require advance partial payment confirmation within 48 hours of booking for high-value reservations
Trigger dedicated follow-up communication (pre-arrival confirmation call or email) for at-risk high-ADR bookings identified by the model
9. Operational Decision Framework
9.1 Risk Scoring at Time of Reservation
The recommended deployment architecture scores every incoming reservation at the moment of booking:
- Capture booking features:
lead_time,market_segment,deposit_type,adr,total_guests, guest history fields - Pass features to deployed Random Forest model via API integration with PMS
- Receive cancellation probability score P(cancel)
- Route booking to deposit policy tier and overbooking accounting based on score:
- P < 0.30 → Standard policy, no intervention
- 0.30 ≤ P < 0.60 → Soft intervention (deposit reminder, flexible terms offer)
- P ≥ 0.60 → Hard intervention (deposit required, booking flagged for monitoring)
9.2 Operator-Level Daily Guidance
Group bookings: Require non-refundable deposit at 90 days out; reconfirm count and rooming lists at 30 and 7 days
Online TA bookings: Apply deposit tiers based on lead time; monitor channel-level cancellation velocity weekly
Direct bookings: Flexible terms to encourage conversion; confirm within 48 hours of booking with a personalized communication
Corporate accounts: Maintain agreed cancellation windows; flag accounts exceeding historical cancellation thresholds for account management review
10. Limitations
This analysis carries several important caveats that should be acknowledged prior to operational deployment:
Dataset specificity: All findings are derived from a single hotel network's historical data. Cancellation rates, segment distributions, and behavioral patterns may differ across hotel types, geographic markets, and price tiers.
Temporal generalization: The model does not explicitly account for seasonality, major events, or macroeconomic disruptions (e.g., pandemic-related cancellation surges). Retraining frequency should be aligned with observed distributional shifts.
Causal vs. associative: Correlation analysis identifies predictive associations, not causal mechanisms. Implementing deposit policy changes based on these patterns requires careful A/B testing to avoid confounding effects.
Agent and company data gaps: The high proportion of missing values in agent and company fields reduces the predictive contribution of these variables and may mask segment-level effects.
Overbooking risk: Model-driven overbooking must be complemented by walkout management protocols and partner hotel arrangements to protect guest experience in the event of full occupancy.
References
DataCo Supply Chain Dataset – Kaggle: https://www.kaggle.com/datasets/jessemostipak/hotel-booking-demand?resource=download
Terno AI – Agentic AI Platform for Data Science: https://yash63.app.terno.ai/chat/share/9b14e530-0d80-4c6d-ac96-ddea8963755b?ui_version=v2
Terno AI chat share link:
Conclusion
This white paper presented a comprehensive data-driven framework for predicting hotel booking cancellations using a dataset of 119,390 reservations. Exploratory analysis identified lead_time as the dominant predictor (correlation: 0.29), supported by behavioral indicators including prior cancellation history and booking changes. Market segment analysis revealed extreme variation in cancellation rates — from 61% for Group bookings to 12% for Complementary stays — underscoring the critical importance of segment-specific policy design.
A baseline Logistic Regression model demonstrated the fundamental limitation of linear approaches for this problem: despite 78% overall accuracy, recall for the cancellation class was only 44%. The Random Forest model achieved substantially improved performance (F1: 0.718, Recall: 69.4%), representing the optimal balance between capturing cancellation risk and maintaining operational precision. XGBoost offered a precision-focused alternative (84.2% precision, 55% recall) for deployment contexts where false positive costs are high.
Final Conclusion: For hotel booking cancellation prediction — characterized by high data volume, non-linear behavioral patterns, and a significant but not extreme class imbalance — Random Forest ensemble methods offer superior practical performance over both linear and gradient boosting approaches. This framework provides a deployable foundation for dynamic deposit policy automation, controlled overbooking, and customer-level risk management, directly translating predictive analytics into measurable revenue protection.
Implementation questions or customized extensions of this analysis may be directed through the Terno.ai platform linked in the References section above.
Read the full whitepaper

18 August 2026
The Honest Number Was 83%: Leakage, Abstention, and a Complaint Router You Can Actually Deploy
The same complaint-routing model scores 96.3% or 83.2% depending on which three columns you leave in the training data. The high number is the intake form being read back to you. This is what the leakage audit found before a single model was trained, why 83.2% is the honest figure, and how the same model — given permission to say "I don't know" — becomes deployable at 90.7% accuracy on 79.5% of traffic.

29 July 2026
EdgeGuard: AI-Driven Predictive Maintenance for Power Transformers
Power transformers are among the most critical assets in electrical distribution infrastructure. Their unexpected failure can result in power outages, safety hazards, equipment damage, expensive repairs, and long service interruptions. Traditional transformer maintenance practices often rely on periodic manual inspection, offline testing, or run-to-failure maintenance. These methods are expensive, slow, labor-intensive, and unable to detect rapidly developing faults in real time. EdgeGuard is an AI-driven, edge-computing predictive maintenance system designed to continuously monitor transformer health and forecast failures before catastrophic damage occurs. The system acts as a retrofittable “Digital Doctor” for distribution transformers by combining low-cost industrial sensors, an ESP32 microcontroller, local intelligence, machine learning-based risk prediction, autonomous relay control, and a real-time web dashboard. The proposed system monitors six major transformer health indicators: temperature, humidity, vibration, oil level, current, and voltage. These signals are normalized and processed through a Multi-Layer Perceptron neural network to classify transformer condition and estimate failure risk. If the predicted risk crosses a critical threshold of 80%, EdgeGuard automatically triggers a relay through GPIO 26 to isolate the transformer from the electrical network. The system also supports secure remote control, dashboard monitoring, API-key-based hardware authentication, JWT-based user access, WebSocket live updates, and automatic live-hardware detection. With an estimated deployment cost of approximately ₹3,850, EdgeGuard offers a low-cost alternative to conventional transformer monitoring systems. Its cloud-independent operation and edge-based decision-making make it especially useful for rural and semi-urban distribution grids where connectivity and maintenance resources are limited.

28 July 2026
ANALYZING TOXIC USER BEHAVIOR AND RISK PATTERNS IN ONLINE GAMING PLATFORMS
This study shows that behavioral data alone can't reliably predict gaming toxicity — but a risk-based model combining behavioral and engineered features does a much better job of flagging the small segment of high-risk users driving disproportionate harm.