Sales Data Analysis for an E-commerce Platform Using Terno AI
Introduction: Transforming E-commerce with AI
In today’s world, data is at the center of decision-making. For e-commerce platforms, analyzing sales data enables businesses to understand customer preferences, optimize supply chain performance, and enhance overall customer satisfaction.
This study utilizes Terno AI to analyze an e-commerce platform’s sales data, examining factors such as delivery efficiency, customer insights, and product performance.
You can see Terno in action here.
Table of Contents
Introduction: Transforming E-commerce with AI
Data Source
Sales Insights, Smarter Decisions
Concepts
Tools
Unlocking Opportunities for Growth
Method
Insights from EDA
Evaluation
Results
Challenges Identified by Terno AI
Conclusion
Data Source
For this study, we worked with the AtliQ Mart FMCG sales and delivery dataset available on Kaggle.
AtliQ is a wholesale FMCG company that runs a B2B model, supplying products to large retailers across different cities.
The dataset includes details about orders placed, quantities ordered and delivered, product information, retail dealer’s details, and delivery timelines.
Sales Insights, Smarter Decisions
For an e-commerce platform, data-driven analysis helps answer key business questions such as:
What are the high-demand products?
Who are the top retailers driving sales?
How efficient are deliveries?
What challenges exist in meeting customer expectations?
By analyzing this data, businesses can reduce costs, improve service quality, and increase revenue.
Concepts
Some of the key concepts discussed in the analysis are:
On-Time Delivery Rate (OT): Percentage of orders delivered on or before the expected time.
In-Full Delivery Rate (IF): Percentage of orders delivered in the exact ordered quantity.
**OTIF Rate: **Measures how many orders were delivered both on time and in full—an important supply chain efficiency metric.
Tools
The analysis was performed using Terno AI, a platform that helps businesses run data analysis in a simplified and automated way using prompts.
It delivers an end-to-end analysis from exploration of datasets to generating insights and providing recommendations.
Unlocking Opportunities for Growth
AtliQ Mart is a **wholesale business **that supplies products like dairy, beverages, and more to large retailers across multiple cities. For this analysis, **Terno **dug into the data with a detailed exploration.
Our goal? To uncover some simple but powerful insights:
Which product categories are the top sellers?
Who are the most valuable retail customers?
And which city takes the lead with the highest number of orders?
This gives us a clear picture of where the business is thriving and where the biggest opportunities lie.
Method
We collected and cleaned sales and delivery data.
Calculated global metrics such as total orders, identified top-performing products and customers based on delivered quantities.
Next, we do detailed EDA and calculate OTIF metrics.
Evaluated supply chain performance using delivery metrics.
Summarized findings and generated results with Terno AI.
Prompt: Use the attached FMCG dataset, and do data cleaning, including missing values, duplicates, nulls, etc. Change column names if needed. Do feature engineering if necessary. After cleaning, do a detailed EDA and understand the KPIs. Find the most valued and sold products, also find the most valued customers. Give all your findings in neat and simple words.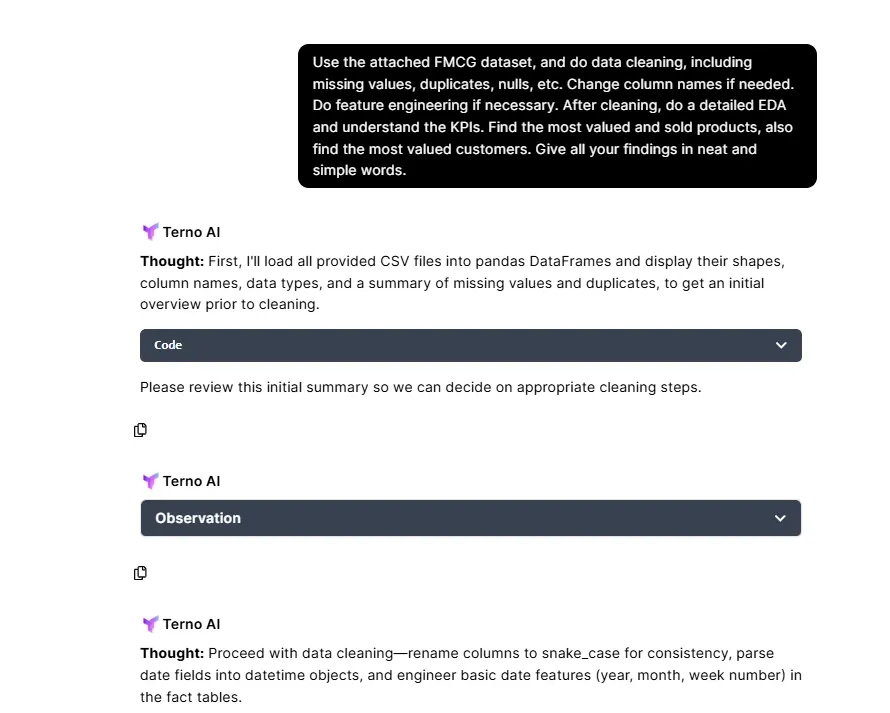
Terno Response: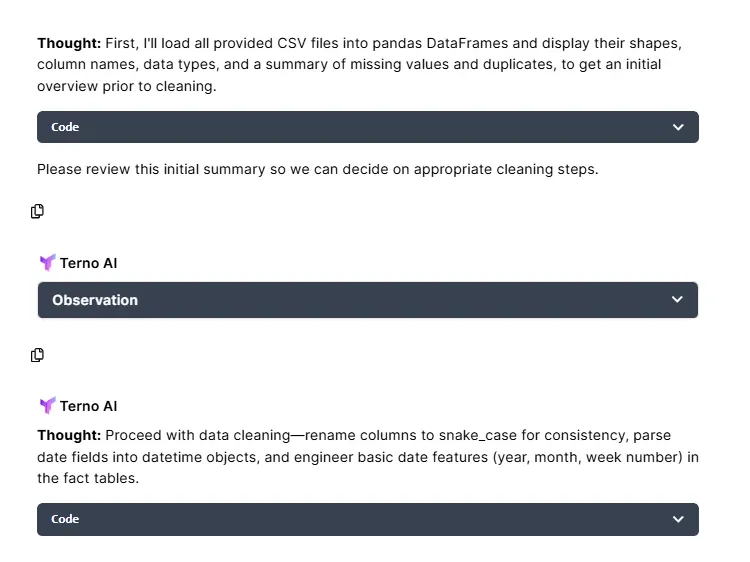
Calculated global metrics such as total orders, identified top-performing products and customers based on delivered quantities.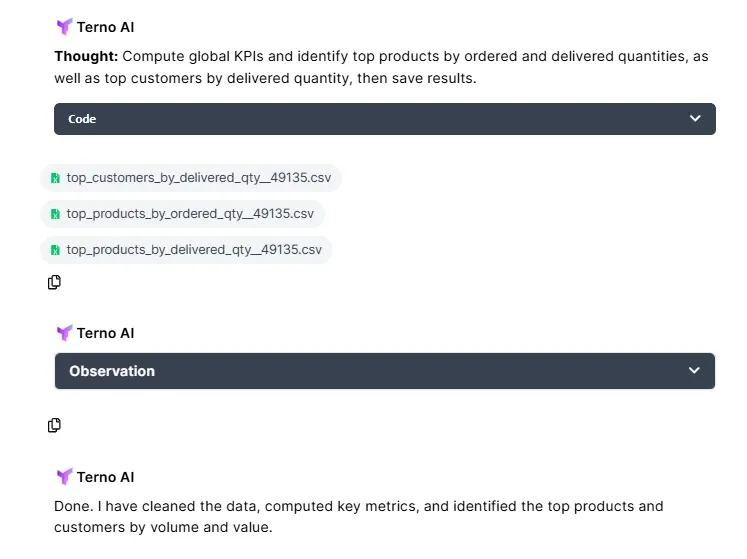
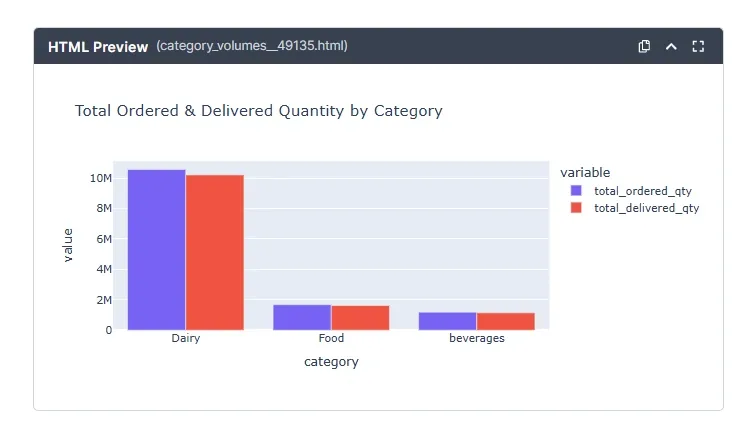
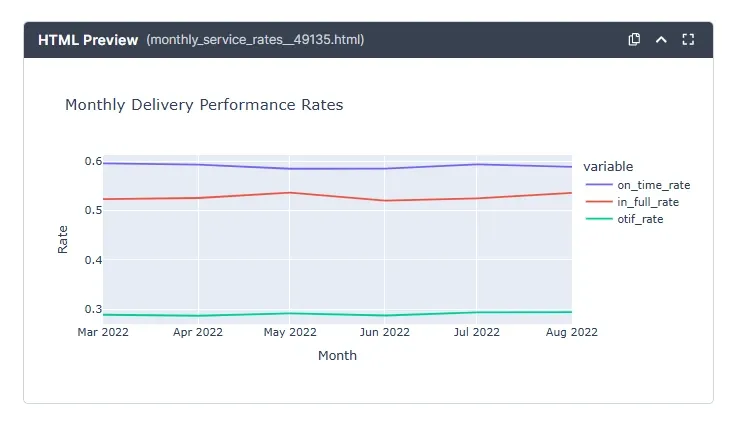
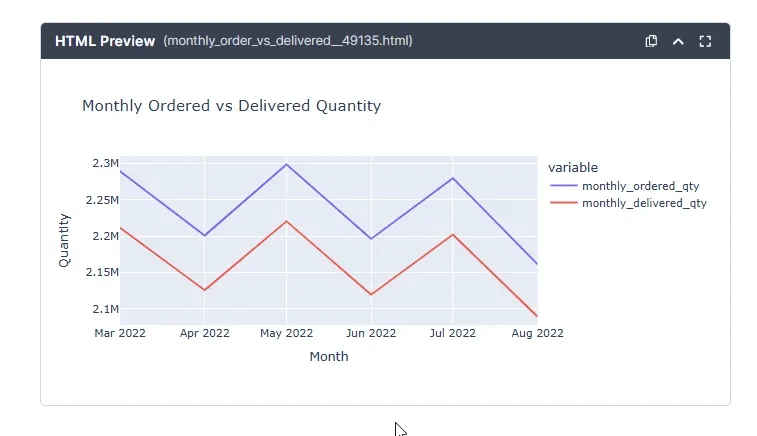
Next, Terno performed detailed EDA and calculated OTIF metrics.
Insights from EDA
Global Metrics
Total unique orders: 31,729
Total ordered quantity: 13,426,936
Total delivered quantity: 12,969,157
On-Time delivery rate: 59.03%
In-Full delivery rate: 52.78%
OTIF rate: 29.02%
Insight:
While order volumes are high, the OTIF rate of 29.02% indicates significant room for improvement in supply chain execution.Milk and curd are the clear heroes of the basket.Delivery performance aligns closely with demand, but slight gaps exist, which may be contributing to lower in-full delivery rates.Sales are concentrated among a few key retail businesses, showing the importance of maintaining strong relationships with large retailers.
Top Retail Stores with the Largest Orders
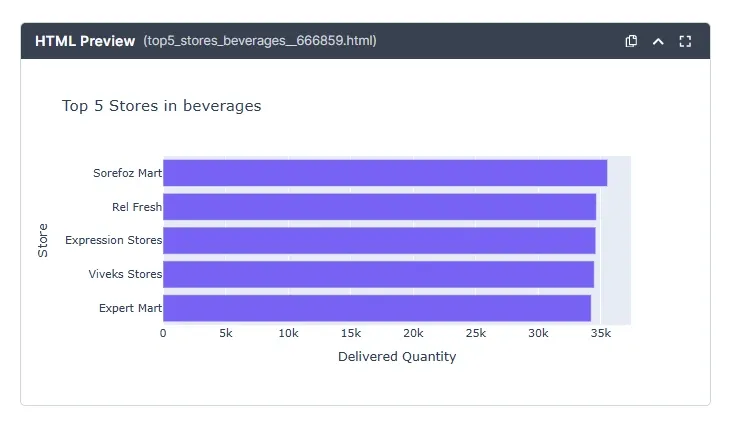
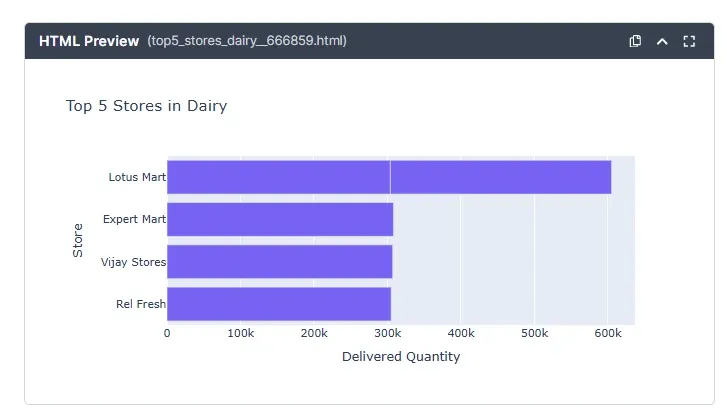
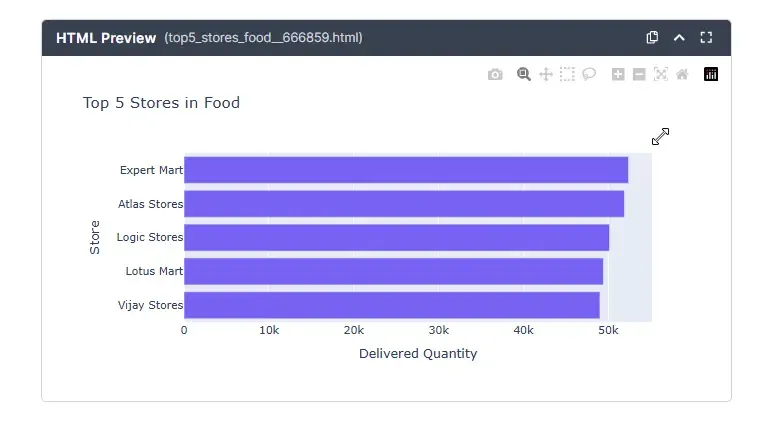
Next, let's look at the retail stores placing the largest orders in each product category. Let's dive in and find out who the top players are.
Prompt: List the top 5 stores in each product category. Use visualizations to support the answer.
Top Cities by Delivered Sales Volume
Prompt: Which are the top cities in each category in terms of sales volume?
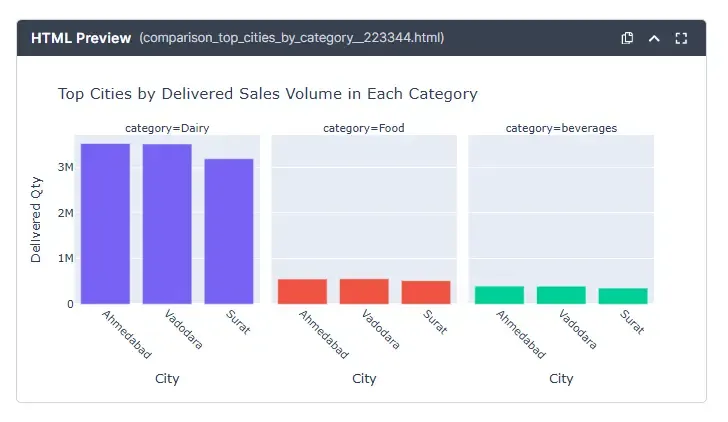
When we broke down sales by category and city, a clear pattern started to emerge.
Dairy turned out to be the biggest mover, with **Ahmedabad **leading the pack at over 3.5 million units, closely followed by Vadodara and Surat.
In Food, the competition was neck-and-neck. Vadodara just edged ahead with 555k units, but Ahmedabad and Surat weren’t far behind.
For Beverages, Ahmedabad once again took the top spot with nearly 396k units, while Vadodara and Surat followed closely.
Category-wise Sales Share
Prompt: Use a pie chart to show the percentage of sales of each category of the total sales
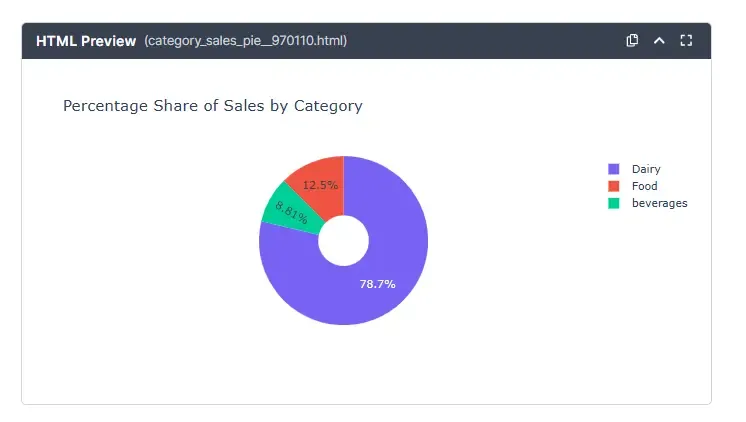
The sales mix shows a clear winner — Dairy dominates with 78.7% of total sales. In comparison, Food contributes 12.5% and Beverages make up 8%.
This tells us that Dairy is the backbone of AtliQ’s business, while Food and Beverages, though smaller, still add meaningful diversity to the overall sales portfolio.
Evaluation
The data shows:
Strong demand for dairy products, particularly milk, in smaller pack sizes.
High dependency on a few customers for bulk sales.
Weak supply chain execution, with less than 30% OTIF performance.
This means customers often face delays or incomplete orders, potentially impacting satisfaction and long-term loyalty.
Results
Sales are healthy, with over 13 million units ordered and nearly all delivered.
Milk products are the main growth driver.
Delivery efficiency is below industry benchmarks (OTIF should ideally be >80%).
A small set of customers drives a large portion of sales.
Challenges Identified by Terno AI
Low OTIF rate (29.02%) – Poor synchronization between order management and delivery.
Gaps in in-full delivery – Indicating stockouts or mismanagement of inventory.
Delayed deliveries – Nearly 40% of orders miss delivery timelines.
Customer concentration risk – A handful of customers hold significant influence over sales.
Conclusion
Digging into this e-commerce platform’s sales data gave us some interesting takeaways. Dairy products are clearly in high demand, and a big chunk of sales still leans heavily on a few key customers.
But here’s the catch — delivery efficiency isn’t quite up to the mark. With an OTIF (On-Time-In-Full) rate of just 29.02%, it’s clear that supply chain execution needs serious attention.
The good news? There’s a lot of room for improvement. With smarter forecasting, tighter inventory management, and diversifying the customer base, the platform can not only strengthen its position but also deliver a much better experience to its customers.

18 August 2026
The Honest Number Was 83%: Leakage, Abstention, and a Complaint Router You Can Actually Deploy
The same complaint-routing model scores 96.3% or 83.2% depending on which three columns you leave in the training data. The high number is the intake form being read back to you. This is what the leakage audit found before a single model was trained, why 83.2% is the honest figure, and how the same model — given permission to say "I don't know" — becomes deployable at 90.7% accuracy on 79.5% of traffic.

29 July 2026
EdgeGuard: AI-Driven Predictive Maintenance for Power Transformers
Power transformers are among the most critical assets in electrical distribution infrastructure. Their unexpected failure can result in power outages, safety hazards, equipment damage, expensive repairs, and long service interruptions. Traditional transformer maintenance practices often rely on periodic manual inspection, offline testing, or run-to-failure maintenance. These methods are expensive, slow, labor-intensive, and unable to detect rapidly developing faults in real time. EdgeGuard is an AI-driven, edge-computing predictive maintenance system designed to continuously monitor transformer health and forecast failures before catastrophic damage occurs. The system acts as a retrofittable “Digital Doctor” for distribution transformers by combining low-cost industrial sensors, an ESP32 microcontroller, local intelligence, machine learning-based risk prediction, autonomous relay control, and a real-time web dashboard. The proposed system monitors six major transformer health indicators: temperature, humidity, vibration, oil level, current, and voltage. These signals are normalized and processed through a Multi-Layer Perceptron neural network to classify transformer condition and estimate failure risk. If the predicted risk crosses a critical threshold of 80%, EdgeGuard automatically triggers a relay through GPIO 26 to isolate the transformer from the electrical network. The system also supports secure remote control, dashboard monitoring, API-key-based hardware authentication, JWT-based user access, WebSocket live updates, and automatic live-hardware detection. With an estimated deployment cost of approximately ₹3,850, EdgeGuard offers a low-cost alternative to conventional transformer monitoring systems. Its cloud-independent operation and edge-based decision-making make it especially useful for rural and semi-urban distribution grids where connectivity and maintenance resources are limited.

28 July 2026
ANALYZING TOXIC USER BEHAVIOR AND RISK PATTERNS IN ONLINE GAMING PLATFORMS
This study shows that behavioral data alone can't reliably predict gaming toxicity — but a risk-based model combining behavioral and engineered features does a much better job of flagging the small segment of high-risk users driving disproportionate harm.