
Who Are Your Best Customers? Segmenting E-Commerce Shoppers with RFM Analysis and K-Means Clustering
Every e-commerce business collects the same raw ingredients — invoices, product IDs, quantities, prices, customer IDs, timestamps. But raw transaction logs don't tell you who your best customers are, who's slipping away, or who just needs the right nudge to spend more. Turning that transactional noise into a clear picture of customer behavior is exactly what this study set out to do.
Using a full year of transactions from a UK-based online retailer, a case study built with Terno AI applies RFM (Recency, Frequency, Monetary) analysis and K-Means clustering to segment customers into meaningful groups — and the results translate directly into marketing and retention strategy.
Here's what the analysis found.
The Problem: Data Without Direction
E-commerce generates enormous volumes of transaction data, but most businesses still lean on Excel, SQL queries, and basic clustering scripts to make sense of it. These approaches don't scale well, take a long time to run, and often miss the deeper behavioral patterns hiding in the data. The result: poor customer targeting, weaker retention, and missed revenue.
The core question behind this study: can automated, data-driven segmentation reveal customer groups clear enough to act on — without requiring a team of analysts to manually pick through spreadsheets?
The Approach
The project used the Online Retail Dataset from Kaggle — real transactional records from a UK-based online store, covering December 2010 to December 2011.
Before cleaning:
1,067,371 rows
8 columns: Invoice No, Stock Code, Description, Quantity, Invoice Date, Price, Customer ID, Country
Data quality issues found:
243,007 missing Customer IDs (removed)
4,382 missing Descriptions (kept as-is)
26,479 duplicate rows (removed)
Records with zero price (filtered out as invalid transactions)
After cleaning: 797,885 rows × 8 columns
The workflow followed a clear pipeline:
Data Collection → Data Preprocessing → EDA & Feature Engineering (RFM) → Clustering → Output Visualization
Preprocessing was handled in Python with Pandas, while EDA, RFM analysis, and clustering were performed using Terno AI.
Exploratory Data Analysis: What the Raw Data Reveals
Quantity and Price Are Both Heavily Skewed
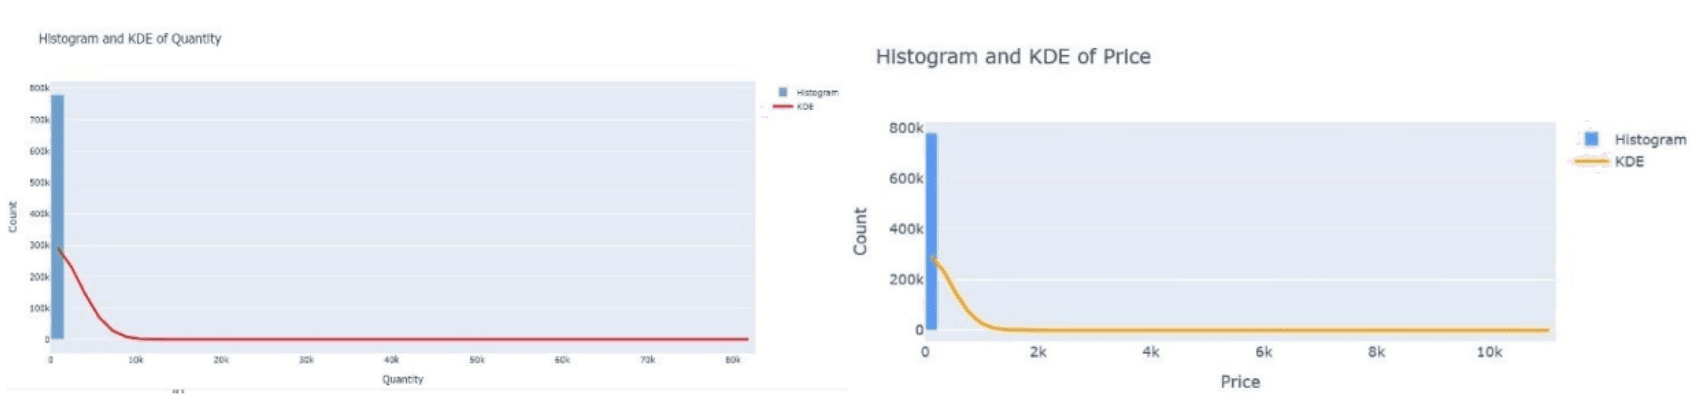
Both variables are highly right-skewed: most transactions involve small quantities at low prices, with a long tail of rare bulk purchases or high-priced items. It's a classic Pareto-like pattern — most values are small, and only a few are exceptionally large.
The UK Dominates the Customer Base
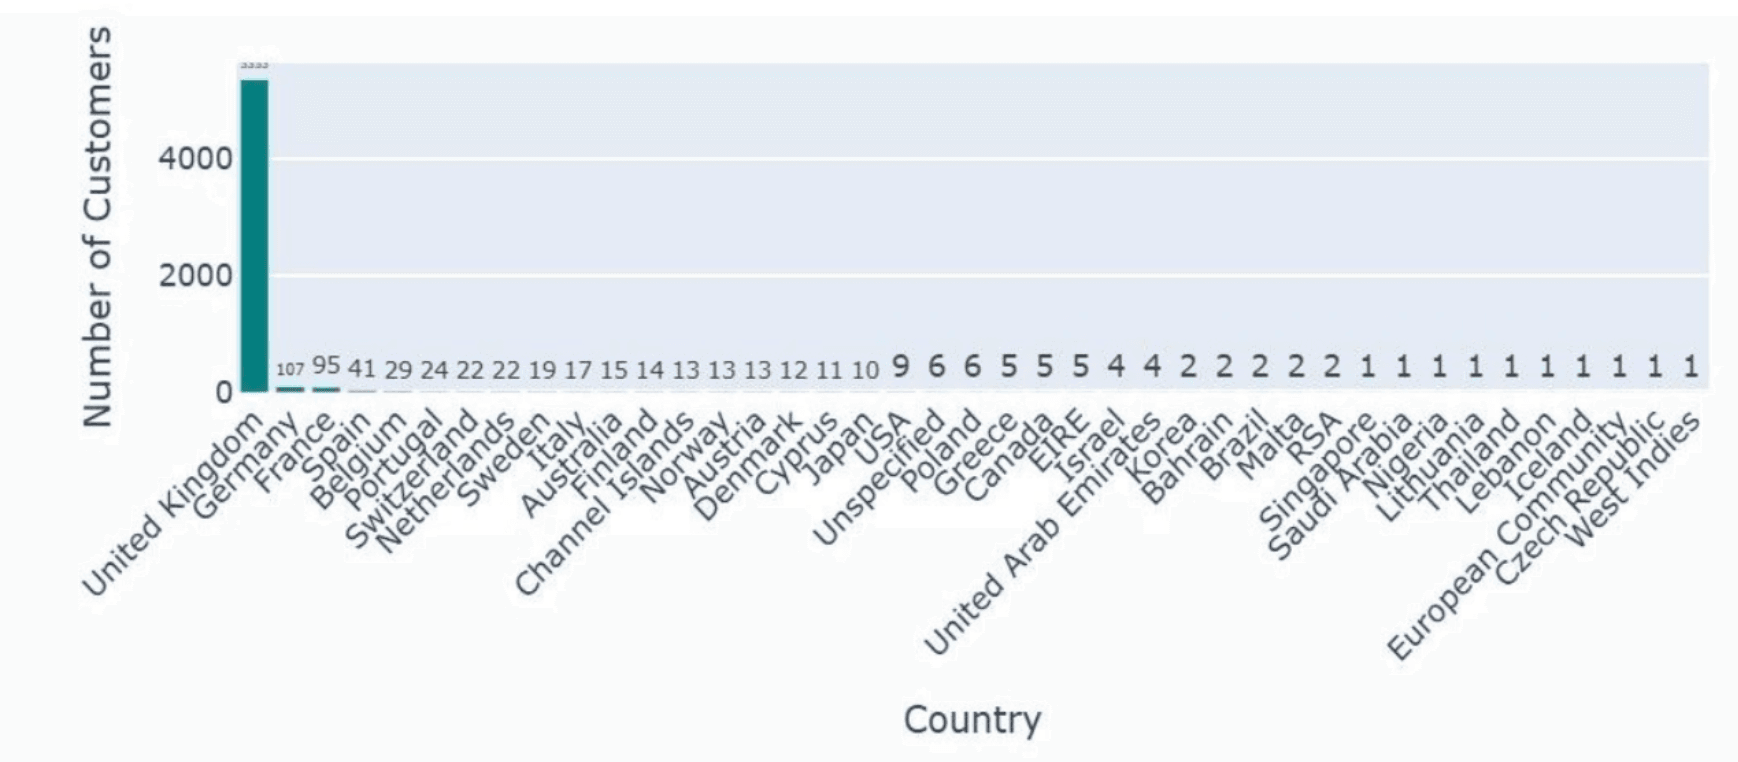
The United Kingdom overwhelmingly dominates the customer base, with far fewer customers from any other country. That's a strong signal of a solid domestic market — but it also points to significant untapped international growth potential.
Sales Are Seasonal, With a Clear Q4 Spike
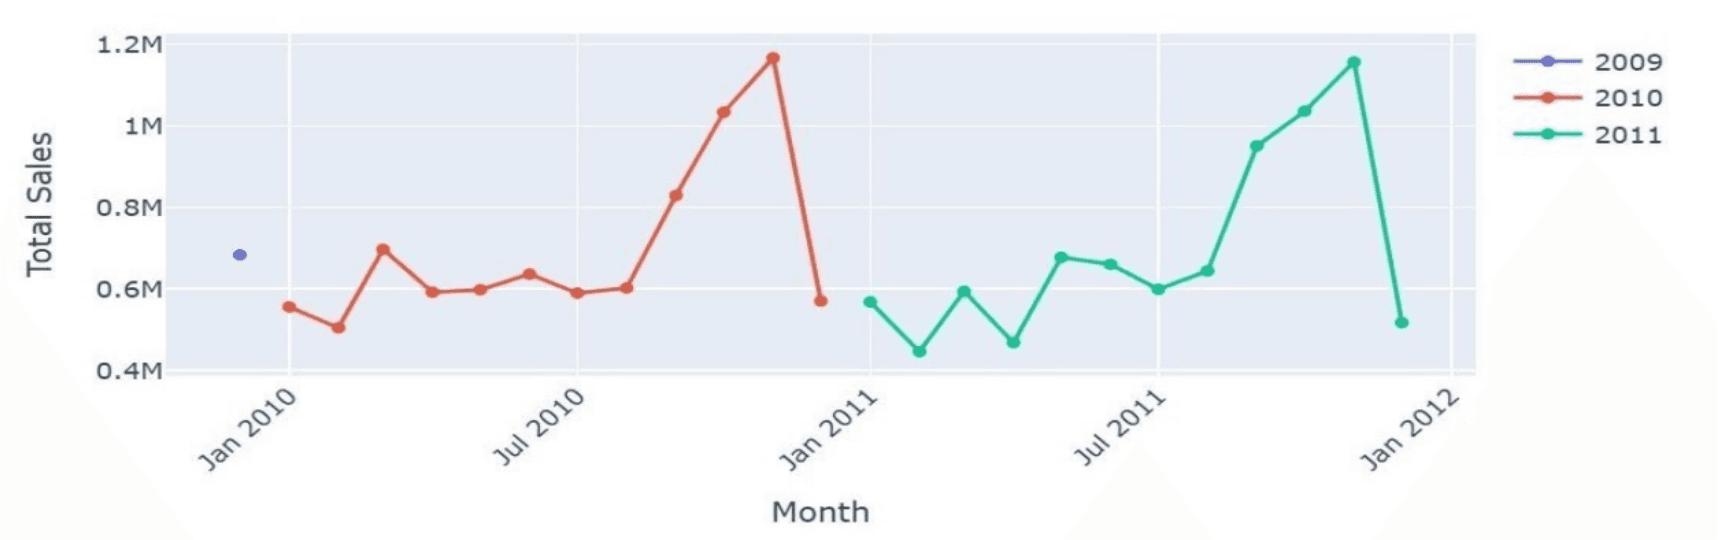
Monthly sales show a distinct seasonal rhythm: strong peaks in October and November (likely holiday-driven), a sharp post-holiday slowdown in January and February, and a smaller mid-year dip around April.
Business takeaway: Businesses should prepare inventory and marketing well ahead of Q4 to capture peak demand, while planning promotions or discounts to lift sales during the slower months.
Best-Sellers by Volume vs. Best-Sellers by Revenue
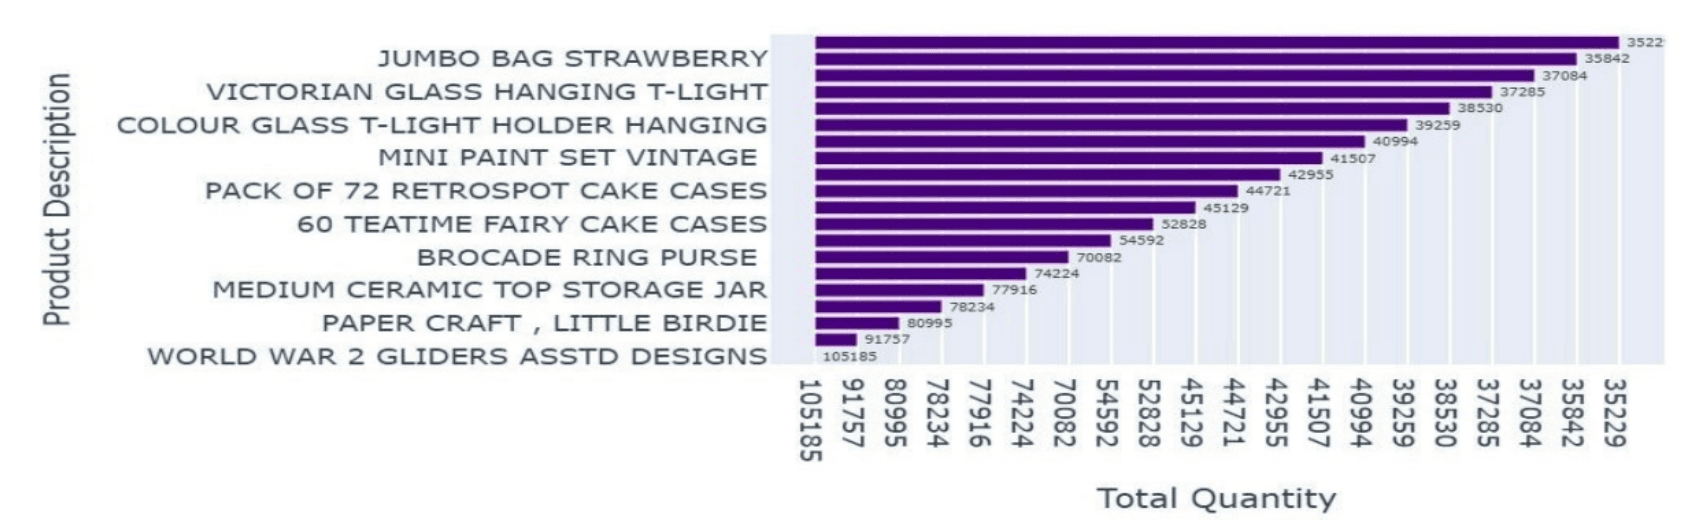
The top products by quantity are mostly low-cost, high-volume items — gliders, t-light holders, craft supplies, and cake cases. The single highest-volume product, "WORLD WAR 2 GLIDERS ASSTD DESIGNS," sold over 105,000 units. The frequent overlap of similar items (multiple t-light holders, multiple cake case designs) suggests real bundling and cross-selling potential.
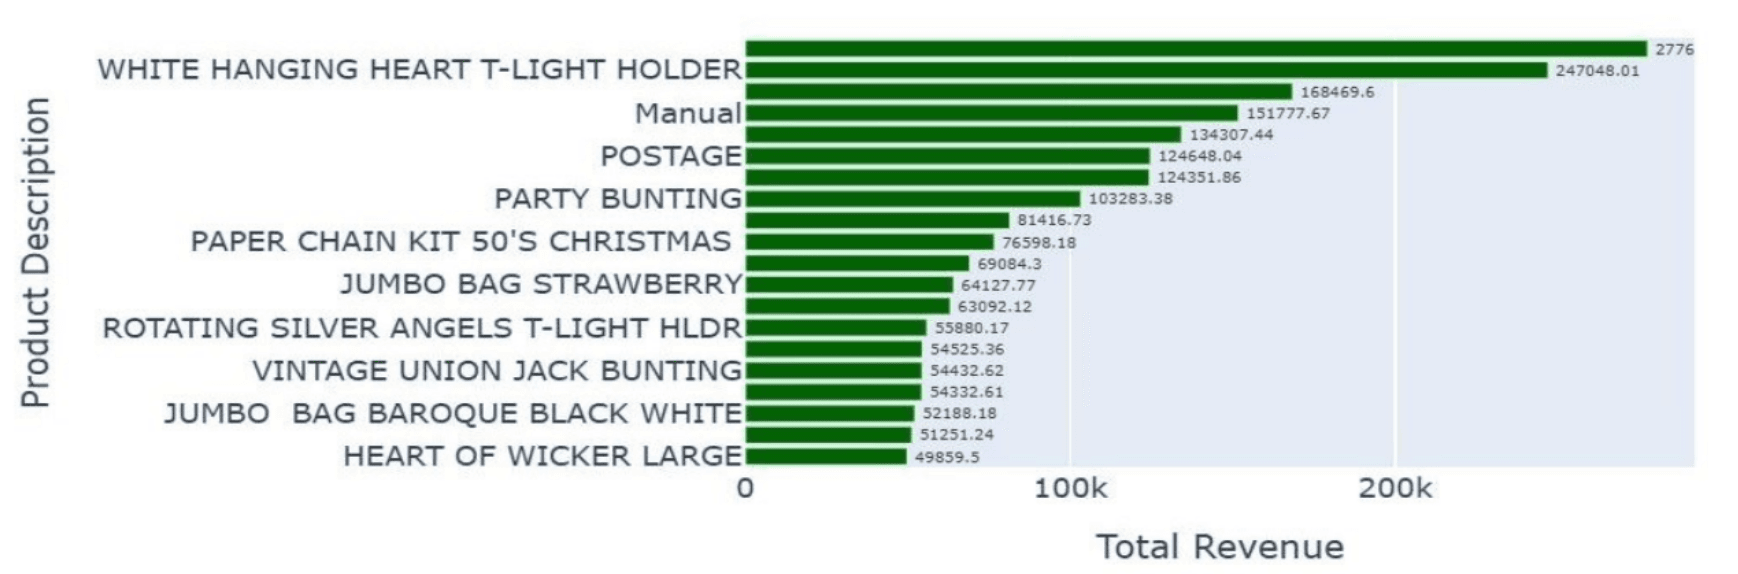
Revenue tells a different story. High-revenue items tend to be premium-priced with lower sales volume but a bigger profit contribution — items like cake stands and t-light holders. One product, "WHITE HANGING HEART T-LIGHT HOLDER," stands out as a genuine star performer, ranking high in both quantity and revenue.
Business takeaways:
Monitor inventory closely on top sellers to avoid stockouts during peak periods.
Bundle high-volume, low-margin items with higher-margin products to lift average order value.
Offer multi-item discounts within the same category (home décor, kitchen storage) to encourage larger baskets.
RFM Insights: Understanding Behavior at the Customer Level
RFM analysis converts raw transactions into three customer-level metrics: Recency (how long since their last purchase), Frequency (how often they buy), and Monetary (how much they spend).
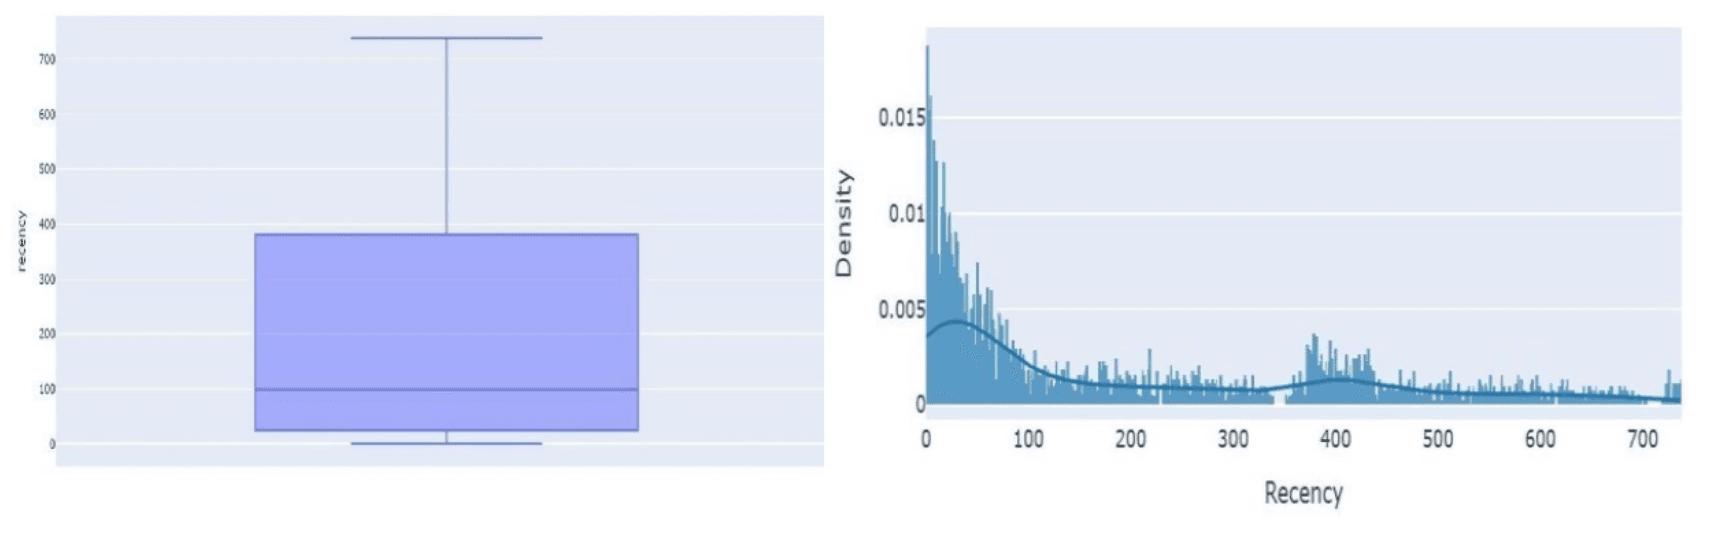
Recency shows a right-skewed distribution — most customers purchased relatively recently, but a meaningful tail hasn't purchased in a long time, pointing to clear re-engagement opportunities for lapsed customers.
(Insert image — Frequency boxplot and histogram/KDE)
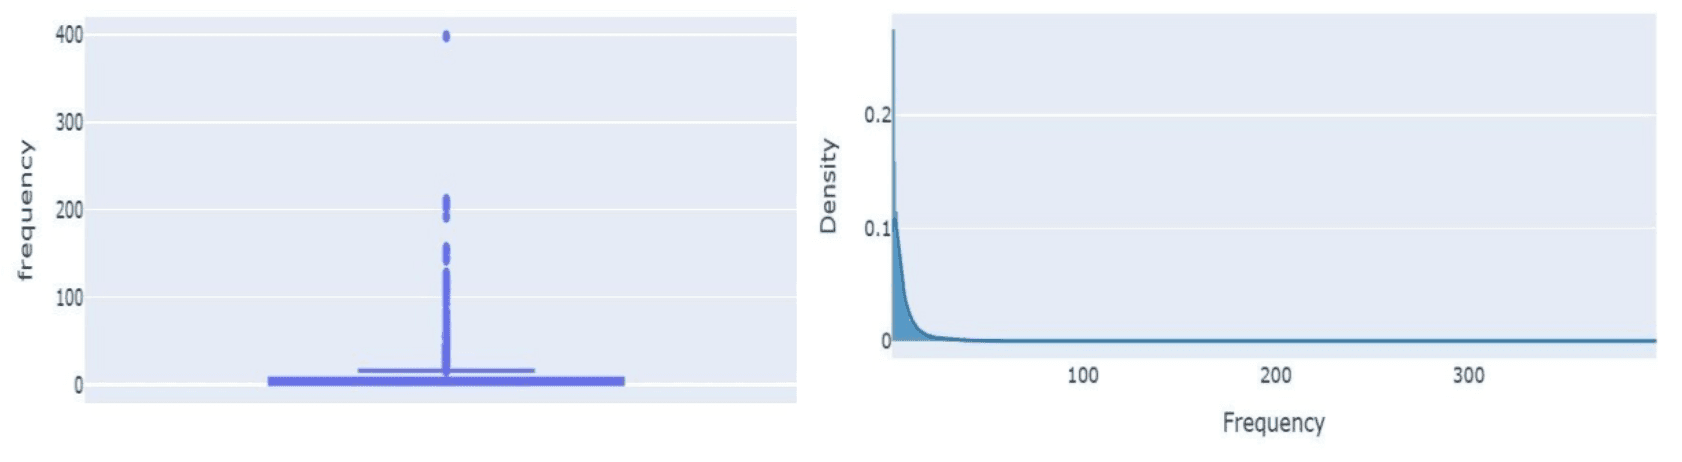
Frequency follows the pattern typical of e-commerce: the majority of customers buy infrequently, while a small group of loyal, repeat buyers purchases far more often than the rest.
Monetary value shows the same shape: most customers spend relatively little, while a small group of big spenders contributes a disproportionately large share of total revenue.
How Recency, Frequency, and Monetary Relate to Each Other
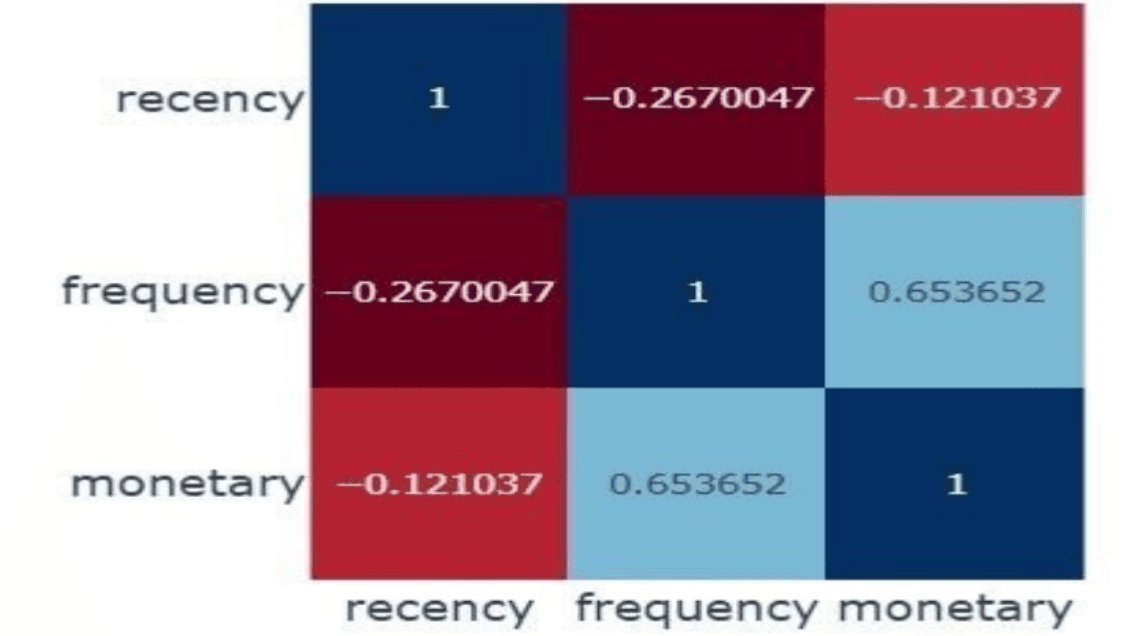
| Relationship | Correlation | Interpretation |
|---|---|---|
| Recency vs Frequency | -0.27 | Weak negative — customers who bought more recently tend to buy somewhat more frequently, but the relationship isn't strong. |
| Frequency vs Monetary | 0.65 | Strong positive — customers who buy more often also tend to spend more. Loyal customers are also high-value. |
| Recency vs Monetary | -0.12 | Very weak negative — a barely-there relationship between recency and spend. |
The standout finding: Frequency and Monetary value move together strongly. Your most frequent shoppers really are your highest-value customers — which makes Frequency a strong lever for driving revenue.
Preparing the Data for Clustering
RFM variables come in very different ranges and are all heavily right-skewed, which is a problem for distance-based clustering algorithms like K-Means. To fix this, the team applied a log transformation to reduce skewness and tame extreme values, followed by feature scaling to make sure Recency, Frequency, and Monetary all contribute equally to the clustering process rather than one variable dominating just because of its scale.
K-Means Clustering: Finding the Right Number of Segments
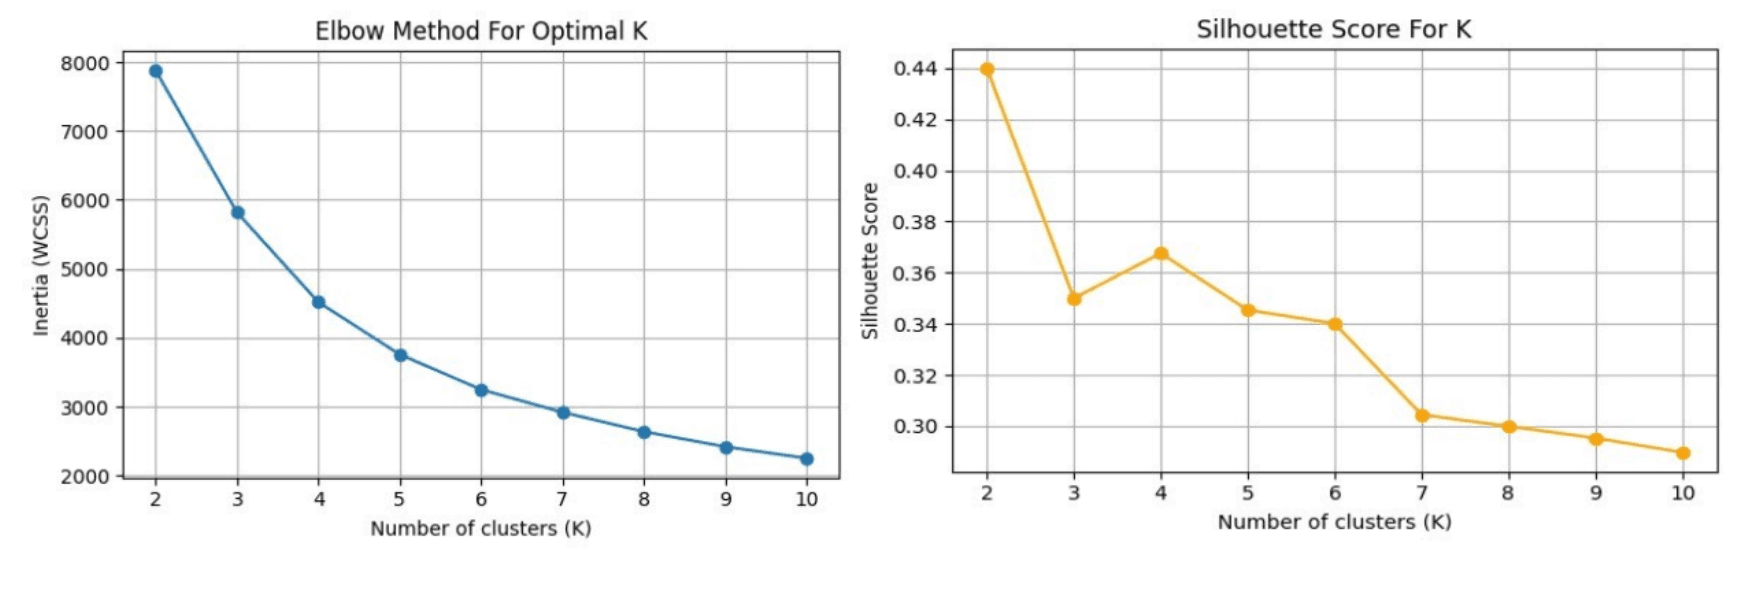
To choose the right number of clusters, the study used both the Elbow Method and the Silhouette Score:
The Elbow plot shows a clear bend at K=3, after which inertia decreases much more slowly.
The Silhouette score is technically highest at K=2, but K=3 comes in nearly as high — and offers a far more actionable, business-relevant segmentation.
Based on this, the study settled on three customer segments.
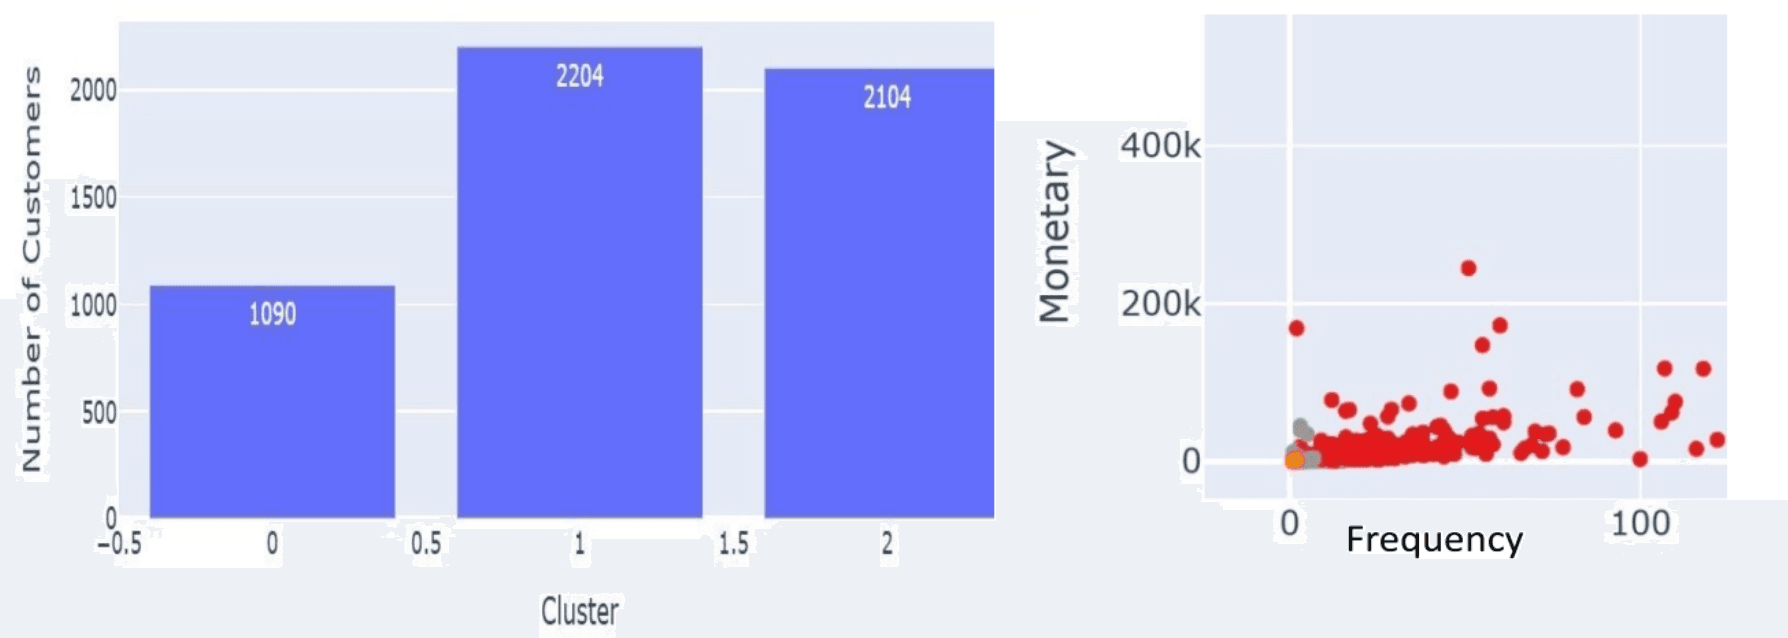
| Cluster | Size (customers) | Recency | Frequency | Monetary | Profile |
|---|---|---|---|---|---|
| 0 | 1,090 | Low (recent) | High | High | High-value, loyal customers |
| 1 | 2,204 | High (not recent) | Low | Low | Inactive, low-value customers |
| 2 | 2,104 | Moderate | Moderate | Moderate | Potential/regular customers |
What Each Segment Means for the Business
Cluster 0 — High-Value Loyal Customers: Recent, frequent, big spenders. This is the smallest group by count but the most valuable per customer — a clear priority for retention and loyalty programs.
Cluster 1 — Inactive/Low-Value Customers: Haven't purchased recently, buy infrequently, spend little. The largest cluster by size — strong candidates for reactivation campaigns and low-cost re-engagement.
Cluster 2 — Potential/Regular Customers: Moderately recent, moderate frequency, moderate spend. This is the "movable middle" — an opportunity for upselling and nurturing toward Cluster 0 behavior.
Business Recommendations
Cluster 0: Focus retention efforts and exclusive offers here to maximize lifetime value.
Cluster 1: Design reactivation campaigns — discounts, reminder emails, win-back offers.
Cluster 2: Target with personalized offers designed to increase purchase frequency and spend, nudging them toward Cluster 0.
What Each Segment Actually Buys
Beyond just labeling segments, the study also looked at product preferences within each cluster — useful for tailoring marketing content, not just offers.
| Cluster | Top Products (by Quantity) |
|---|---|
| 0 (High Frequency/Monetary) | Mini Paint Set Vintage (864), World War 2 Gliders Asstd Designs (576), Wooden Box of Dominoes (216), 3 Piece Spaceboy Cookie Cutter Set (150), Pack of 60 Spaceboy Cake Cases (144) |
| 1 | Hanging Chick Green Decoration (26), Hanging Chick Cream Decoration (25), Filigris Heart with Butterfly (24), Hanging Chick Yellow Decoration (24), Zinc Finish 15cm Planter Pots (20) |
| 2 | Dinosaur Keyrings Assorted (36), Small Popcorn Holder (36), Small Red Retrospot Windmill (36), Hanging Chick Yellow Decoration (26), Easter Bunny Garland of Flowers (24) |
Interestingly, high-value customers (Cluster 0) tend to buy in noticeably larger quantities per product than the other segments — reinforcing that this group isn't just loyal, but also drives meaningfully larger order volumes.
Key Takeaways
- Most revenue comes from a small share of customers. RFM distributions show a classic 80/20 pattern — a small group of frequent, high-spending customers contributes disproportionately to revenue.
- Frequency is the strongest predictor of value. The 0.65 correlation between Frequency and Monetary means encouraging more frequent purchases is a direct lever for revenue growth.
- Three clusters tell a clear, actionable story: loyal high-value customers, inactive low-value customers, and a "movable middle" of regular customers.
- Sales are strongly seasonal, peaking in Q4 — a critical planning window for inventory and marketing.
- Product strategy should follow segment behavior: high-volume, low-margin items make sense for cross-selling and bundling, while premium, high-revenue items need close inventory management.
- Automated, scalable segmentation beats manual analysis. Using Terno AI to run EDA, RFM, and clustering end-to-end replaces slow, manual Excel/SQL work with a faster, repeatable pipeline.
Why This Matters
Segmentation isn't just an academic exercise — it directly shapes where marketing budget and retention effort should go. Knowing that a defined group of ~1,090 customers drives disproportionate revenue means loyalty programs and premium offers can be targeted precisely rather than blasted broadly. Knowing that another ~2,200 customers have gone quiet means reactivation campaigns have a clear, sized audience to target. And the "movable middle" of ~2,100 regular customers represents real, quantifiable upside if nurtured correctly.
This case study shows that with the right combination of RFM analysis, feature engineering, and clustering — all automated through a platform like Terno AI — businesses can move from raw transaction logs to a clear, actionable customer strategy without needing a large data science team to get there.
Read the full white paper here

18 August 2026
The Honest Number Was 83%: Leakage, Abstention, and a Complaint Router You Can Actually Deploy
The same complaint-routing model scores 96.3% or 83.2% depending on which three columns you leave in the training data. The high number is the intake form being read back to you. This is what the leakage audit found before a single model was trained, why 83.2% is the honest figure, and how the same model — given permission to say "I don't know" — becomes deployable at 90.7% accuracy on 79.5% of traffic.

29 July 2026
EdgeGuard: AI-Driven Predictive Maintenance for Power Transformers
Power transformers are among the most critical assets in electrical distribution infrastructure. Their unexpected failure can result in power outages, safety hazards, equipment damage, expensive repairs, and long service interruptions. Traditional transformer maintenance practices often rely on periodic manual inspection, offline testing, or run-to-failure maintenance. These methods are expensive, slow, labor-intensive, and unable to detect rapidly developing faults in real time. EdgeGuard is an AI-driven, edge-computing predictive maintenance system designed to continuously monitor transformer health and forecast failures before catastrophic damage occurs. The system acts as a retrofittable “Digital Doctor” for distribution transformers by combining low-cost industrial sensors, an ESP32 microcontroller, local intelligence, machine learning-based risk prediction, autonomous relay control, and a real-time web dashboard. The proposed system monitors six major transformer health indicators: temperature, humidity, vibration, oil level, current, and voltage. These signals are normalized and processed through a Multi-Layer Perceptron neural network to classify transformer condition and estimate failure risk. If the predicted risk crosses a critical threshold of 80%, EdgeGuard automatically triggers a relay through GPIO 26 to isolate the transformer from the electrical network. The system also supports secure remote control, dashboard monitoring, API-key-based hardware authentication, JWT-based user access, WebSocket live updates, and automatic live-hardware detection. With an estimated deployment cost of approximately ₹3,850, EdgeGuard offers a low-cost alternative to conventional transformer monitoring systems. Its cloud-independent operation and edge-based decision-making make it especially useful for rural and semi-urban distribution grids where connectivity and maintenance resources are limited.

28 July 2026
ANALYZING TOXIC USER BEHAVIOR AND RISK PATTERNS IN ONLINE GAMING PLATFORMS
This study shows that behavioral data alone can't reliably predict gaming toxicity — but a risk-based model combining behavioral and engineered features does a much better job of flagging the small segment of high-risk users driving disproportionate harm.