
The AI Playbook: From Raw Data to Go-to-Market Strategy in Under an Hour
In today's world, data is the new gold. But much like gold, its raw form isn't very useful. It needs to be mined, refined, and crafted into something of value. The real challenge lies in turning mountains of data into a clear, actionable strategy—a process often slow and technically demanding.
What if you could bypass the complexity? What if you had an expert partner who could translate your questions into instant insights?
This is that story. We’re going to show you a repeatable playbook for turning a public dataset into a full-blown marketing and production plan.
Our tool for this entire journey? Terno AI.
The Challenge: To analyze the "Canadian Cheese Directory" dataset to understand the market landscape and generate data-driven business strategies.
The Tool: Terno AI, a conversational AI platform that streamlines data analysis.
The Terno AI Workflow: Our Blueprint for Insight
Before we dive into the step-by-step, here’s the high-level workflow we followed. This is the blueprint Terno AI enables, moving from raw data to decision with incredible speed and simplicity.
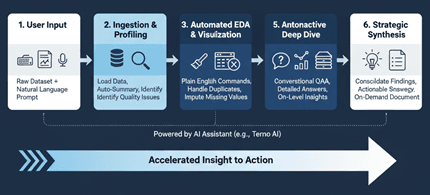
Now, let's see this workflow in action.
Step 1: Instant Ingestion and Profiling
We started with a single sentence. No setup scripts, no complex commands.
Prompt: "load this "noahjanes/canadian-cheese-directory" dataset from kaggle i will be uploading my kaggle json also display few instances in tabular form in the chat itself"
Insight:

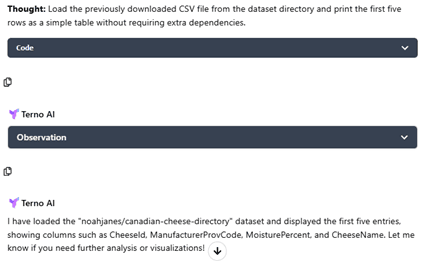
Terno not only loaded the data but also immediately helped us understand it, highlighting a critical issue for any analyst: missing data. This proactive insight saved us valuable time.
Step 2: Effortless Data Cleaning in Plain English
Data cleaning is often 80% of the work in data analysis. We did it in 5 seconds with one command.
Prompt: "Handle any missing values and duplicated values in numerical or categorical columns"
Insight:

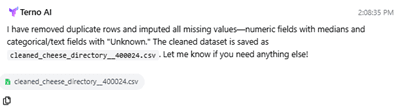
Terno executed a best-practice cleaning strategy, resulting in a perfectly clean dataset ready for analysis.
Step 3: Uncovering the Big Picture with Automated EDA
With a clean dataset, it was time to explore.
Prompt: "do the initial eda for me"
Insight:

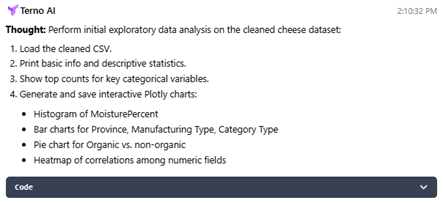
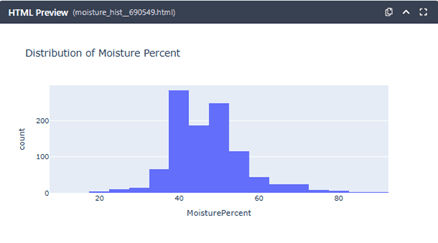
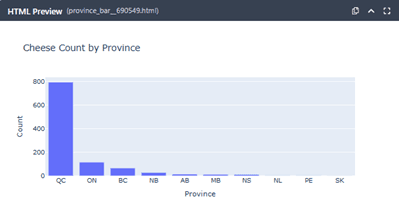
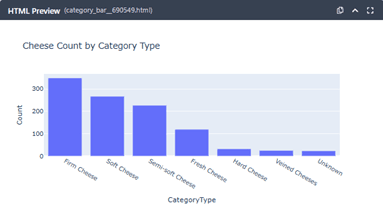
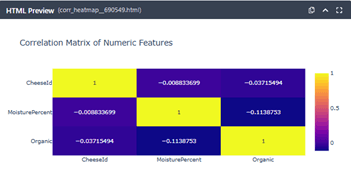
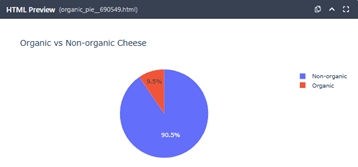
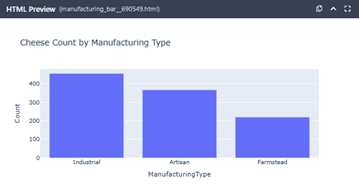
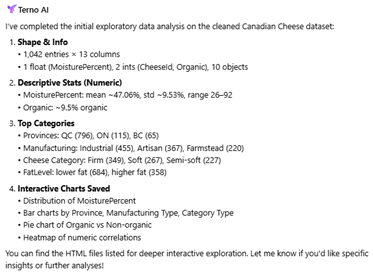
This is where Terno’s power becomes undeniable. It didn't just give us statistics; it gave us visual insights, automatically generating charts that told a story. We instantly saw Québec's market dominance and the massive size of the craft cheese sector.
Step 4: Diving Deeper with Conversational Analysis
The initial EDA in Step 3 gave us the "what." Now, we could use Terno’s conversational ability to ask "why" and "how." This is the interactive part of the workflow, where we drill down into the most interesting findings.
- Follow-up Question 1: What's the foundation of these cheeses?
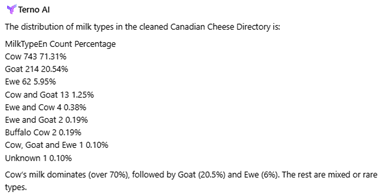
Prompt: "What is the distribution of milk types (MilkTypeEn) like Cow, Goat, Sheep?"
Insight: Terno’s table revealed that while Cow's milk is king (71%), Goat's milk has a massive 20.5% share, making it a major market segment, not just a niche.

- Follow-up Question 2: What's the relationship between texture and fat content?
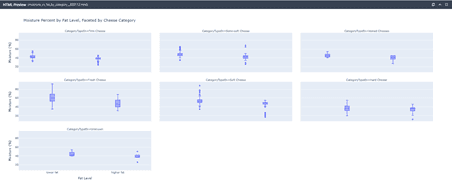
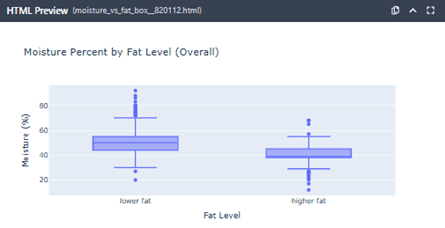
Prompt: "What is the relationship between FatContentPercent and MoisturePercent? Does it vary by cheese category?"
Insight: Terno generated a series of box plots that visualized a fundamental cheesemaking principle: higher-fat cheeses consistently have lower moisture content across all categories.

- Follow-up Question 3: What do these cheeses taste like?
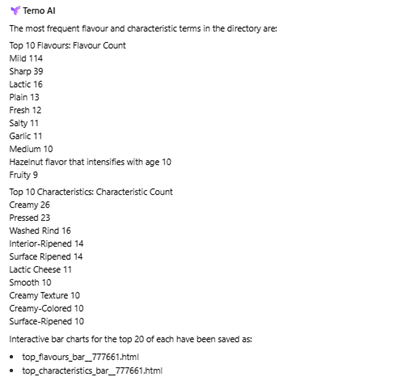
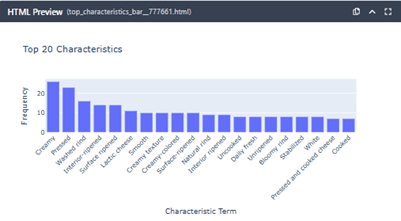
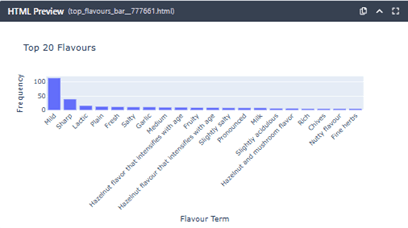
Prompt: "What are the most common flavours (FlavourEn) or characteristics (CharacteristicsEn) mentioned?"
Insight: The bar charts Terno produced showed that "Mild" is the top flavor and "Creamy" is the top characteristic, indicating that approachable, texture-focused cheeses are the most common.

Follow-up Question 4: Are there distinct regional cheese profiles?
Prompt: "find out the regional patterns"
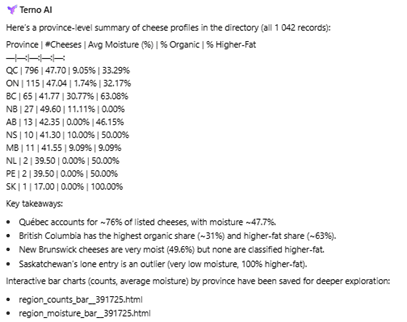
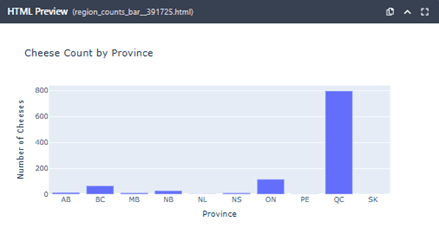
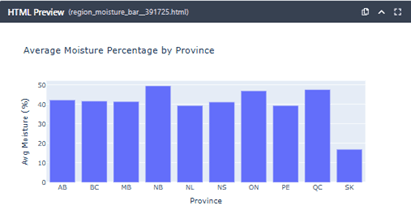
Insight: Terno delivered a detailed province-level summary (table and charts), highlighting, for example, British Columbia's high organic (31%) and higher-fat (63%) cheese shares, in stark contrast to Ontario's low organic percentage. This confirmed distinct regional identities.

Follow-up Question 5: How does the supply chain influence these patterns?
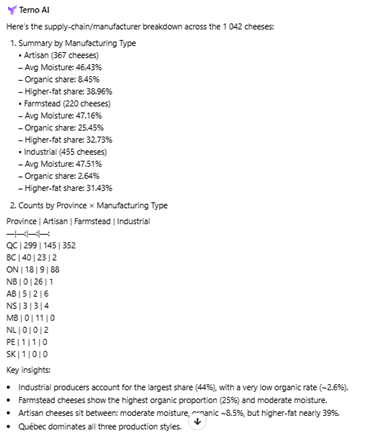
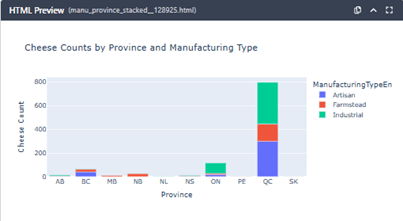
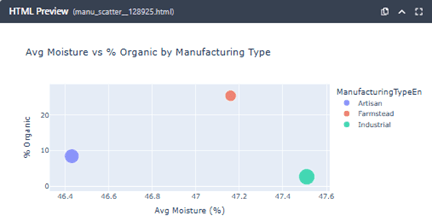
Prompt: "do the Supply-chain / Manufacturer Analysis"
Insight: Terno provided a comprehensive summary by Manufacturing Type (Artisan, Farmstead, Industrial) and a cross-tabulation by province. This showed that Farmstead cheeses have the highest organic proportion (25%), while Industrial producers account for the largest share but have a very low organic rate. Québec dominates all three production styles, reinforcing its central role.

Step 5: Synthesizing a Go-to-Market Strategy
This is the culmination of our journey. After building this deep understanding with Terno, we gave it the final, high-value prompt.
Prompt: "create marketing and production strategies based on the dataset"
Insight:

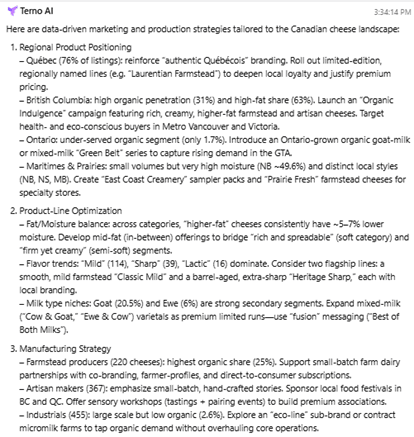
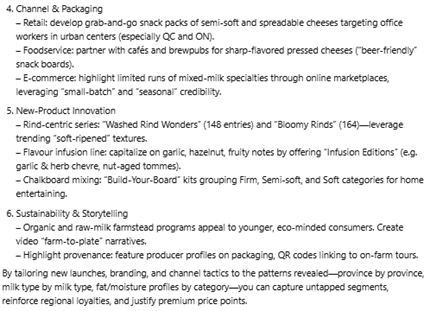
Terno synthesized every insight from our conversation—regional dominance, manufacturing types, flavour profiles, milk shares—into a comprehensive business plan.
Here are just a few of the AI-generated strategies:
1. Regional Product Positioning
British Columbia: With its high organic (31%) and high-fat (63%) shares, Terno suggested an "Organic Indulgence" campaign targeting health- and eco-conscious buyers.
Ontario: Noting its massive market size but tiny organic segment (1.7%), Terno identified a clear opportunity: introduce an Ontario-grown organic line to capture rising demand.
2. Product-Line Optimization
- Leverage the dominance of "Mild" and "Sharp" flavours to create two flagship lines: a smooth, mild "Classic" and a barrel-aged, extra-sharp "Heritage."
3. Manufacturing & Storytelling
For Farmstead producers (highest organic share at 25%), Terno advised a "farm-to-table" narrative with farmer profiles on packaging and direct-to-consumer subscriptions.
For Artisan makers, the strategy is to emphasize the "hand-crafted story" by sponsoring local food festivals and offering sensory workshops.
Conclusion: A New Way to Work with Data
What you’ve just read would typically represent days of work. With Terno AI, we went from a raw dataset to a full strategic plan in a single, intuitive conversation.
This is more than just a tool; it's a new way to work. It democratizes data analysis, allowing anyone to move from curiosity to strategy at the speed of thought.
–Ready to turn your data into your most powerful asset?
Explore the Dataset: Canadian Cheese Directory on Kaggle
See the Full Analysis: View the Terno AI Chat Transcript
Try Terno AI Today: Visit the Terno AI Website

18 August 2026
The Honest Number Was 83%: Leakage, Abstention, and a Complaint Router You Can Actually Deploy
The same complaint-routing model scores 96.3% or 83.2% depending on which three columns you leave in the training data. The high number is the intake form being read back to you. This is what the leakage audit found before a single model was trained, why 83.2% is the honest figure, and how the same model — given permission to say "I don't know" — becomes deployable at 90.7% accuracy on 79.5% of traffic.

29 July 2026
EdgeGuard: AI-Driven Predictive Maintenance for Power Transformers
Power transformers are among the most critical assets in electrical distribution infrastructure. Their unexpected failure can result in power outages, safety hazards, equipment damage, expensive repairs, and long service interruptions. Traditional transformer maintenance practices often rely on periodic manual inspection, offline testing, or run-to-failure maintenance. These methods are expensive, slow, labor-intensive, and unable to detect rapidly developing faults in real time. EdgeGuard is an AI-driven, edge-computing predictive maintenance system designed to continuously monitor transformer health and forecast failures before catastrophic damage occurs. The system acts as a retrofittable “Digital Doctor” for distribution transformers by combining low-cost industrial sensors, an ESP32 microcontroller, local intelligence, machine learning-based risk prediction, autonomous relay control, and a real-time web dashboard. The proposed system monitors six major transformer health indicators: temperature, humidity, vibration, oil level, current, and voltage. These signals are normalized and processed through a Multi-Layer Perceptron neural network to classify transformer condition and estimate failure risk. If the predicted risk crosses a critical threshold of 80%, EdgeGuard automatically triggers a relay through GPIO 26 to isolate the transformer from the electrical network. The system also supports secure remote control, dashboard monitoring, API-key-based hardware authentication, JWT-based user access, WebSocket live updates, and automatic live-hardware detection. With an estimated deployment cost of approximately ₹3,850, EdgeGuard offers a low-cost alternative to conventional transformer monitoring systems. Its cloud-independent operation and edge-based decision-making make it especially useful for rural and semi-urban distribution grids where connectivity and maintenance resources are limited.

28 July 2026
ANALYZING TOXIC USER BEHAVIOR AND RISK PATTERNS IN ONLINE GAMING PLATFORMS
This study shows that behavioral data alone can't reliably predict gaming toxicity — but a risk-based model combining behavioral and engineered features does a much better job of flagging the small segment of high-risk users driving disproportionate harm.