Understanding Key Factors Affecting Health Insurance Premium Using Terno AI
Are You Paying Too Much for Insurance? A Data-Driven Look
Ever wondered why your insurance bill looks the way it does? In this study, we set out to uncover how different demographic and personal factors—like age, lifestyle, and income—impact insurance charges. The goal is simple: to help you figure out whether you’re actually paying a fair amount.
Table of Contents
Data Source
Why is Insurance Important?
Questions to Answer
Goals
Concepts
Tools
Method
Data Analysis Using Terno AI
Evaluation
From Questions to Answers
Challenges Identified by Terno AI
Recommendations by Terno AI
Conclusion
Data Source
Why is Insurance Important?
Life is unpredictable, and that’s what makes** insurance **such an essential financial safety net. Health insurance, for example, helps protect your savings when unexpected medical expenses arise. Instead of draining your hard-earned income during tough times, the right policy steps in to cover the costs.
But it’s not just about having insurance—it’s about understanding the factors that matter when choosing a plan. By knowing what drives insurance charges, you can make smarter, more informed decisions that truly protect your future.
Questions to Answer
Which feature is the **strongest reason **for the premium?Is **BMI a key factor **in insurance premiums?Between **age and smoking habit**, which has a stronger relationship with the premium?Does **taking insurance early** help in reducing the premium amount?
Goals
Understand the **key factors** affecting insurance premiums.**Predict** our insurance premium levels based on our data.
Concepts
BMI (Body Mass Index)
BMI is used to assess whether a person has a **healthy body** weight for their height.Categorize individuals as underweight, normal weight, overweight, or obese.Formula: BMI = **Weight (kg)** / **Height (m)2**
BMI Range
| BMI Value | Category |
|---|---|
| Less Than 16 | Severely underweight |
| 16.0 - 16.9 | Moderately underweight |
| 17.0 - 18.4 | Mildly underweight |
| 18.5 - 24.9 | Normal weight |
| 25.0 - 29.9 | Overweight |
| 30.0 - 34.9 | Obese Class I (Moderate) |
| 35.0 - 39.9 | Obese Class II (Severe) |
| 40.0 & Above | Obese Class III (Very severe) |
Tools
Terno AI
Terno AI is a secure, conversational AI-Powered Data Scientist that helps you make fast, accurate insights using natural language tailored to your data. It is a very useful tool for data solutions that save time and help you focus on more important matters. Uncovering trends and patterns from data is a tedious process when we do it manually. But for Terno AI, it's just a walk in the park. We will see how Terno AI makes our work easy and fast, while being accurate and error-free.
Now that we have the data, we start our process. This is where **Terno AI** comes in. Generally, we have to clean each column, ensure data consistency, and preprocess the data manually ourselves.
Connect to Dataset
Next, we connect to the downloaded dataset by uploading the CSV file to Terno AI.
Prompt to Terno AI
Now we ask Terno AI to make an analysis and a prediction using the prompt:
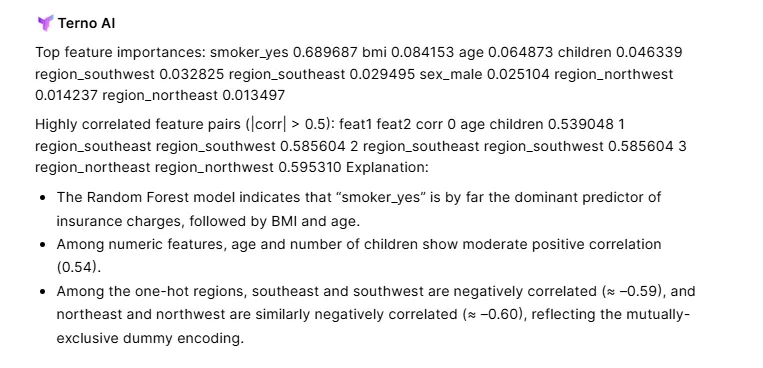
Prompt: Use the Nebil Divay_ds_4 insurance_records with columns age,sex,bmi,childrem smoker,region and charges. Generate a prediction model using this dataset and understand the key features that contribute to the charges. Also, give information on which are the features that are closely related to each other
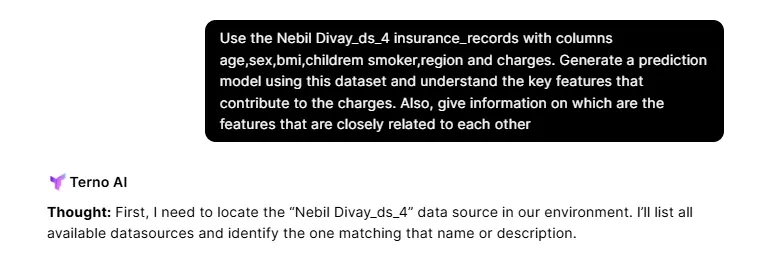
Terno Response:
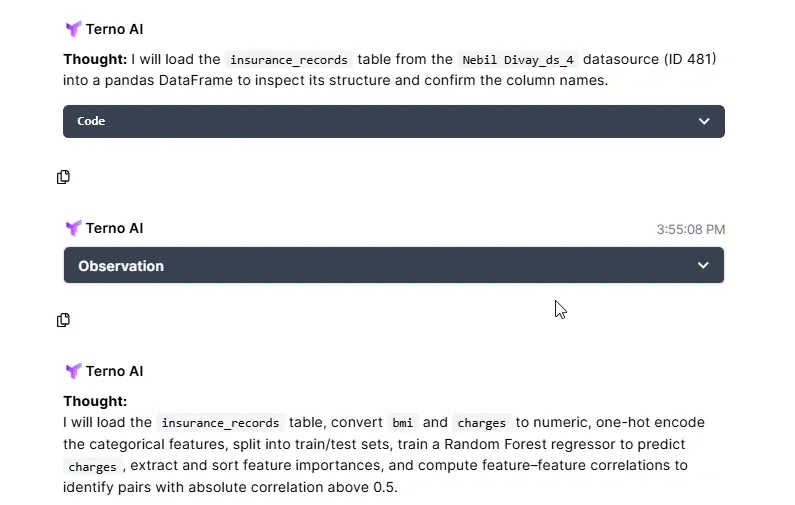
Findings by Terno AI
Data Analysis Using Terno AI
We will use data analysis to understand the structure of data, find **relationships **between features, and derive any insights that can help in making informed decisions. Just like before, we give a prompt to Terno AI in simple English and let Terno AI do its thing.
Prompt: Use charts and other visualizations to give insights into data and how the features are related to each other
Distribution of Insurance Charges
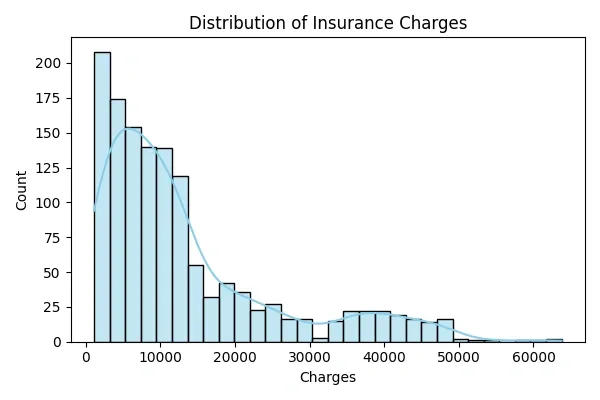
Charges are right-skewed, with most policyholders paying below $20 000, but a long tail up to over $60 000.
Charges by Smoker Status
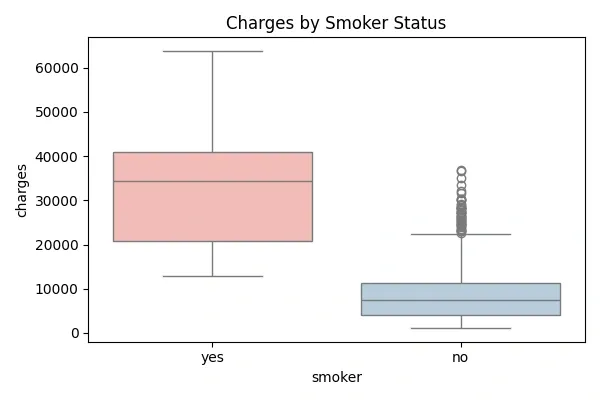
Smokers (red) incur dramatically higher and more variable charges than non-smokers (green).
Charges by Region
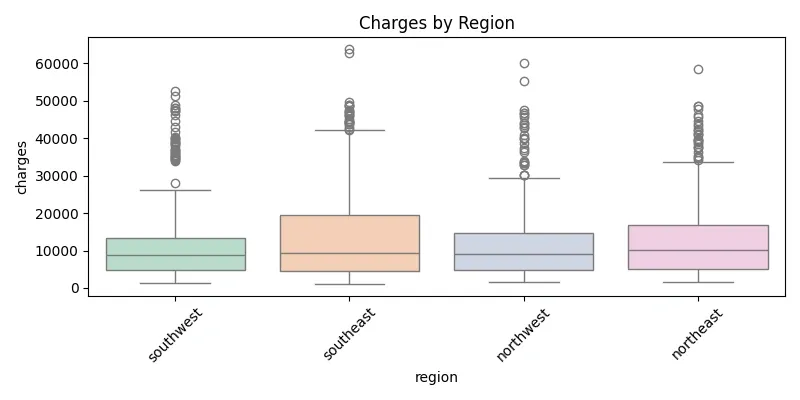
Median charges are roughly similar across regions, though the southwest and southeast show slightly wider spreads.
Age vs. Charges (Colored by Smoker)
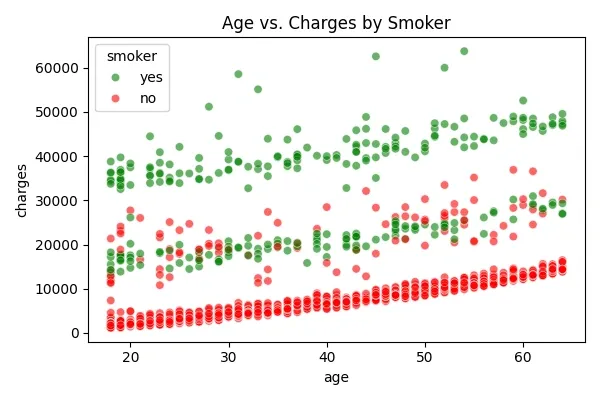
Older smokers tend to have the **highest **charges; for non-smokers, age has a milder upward trend.
BMI vs Charges (Colored by Smoker)
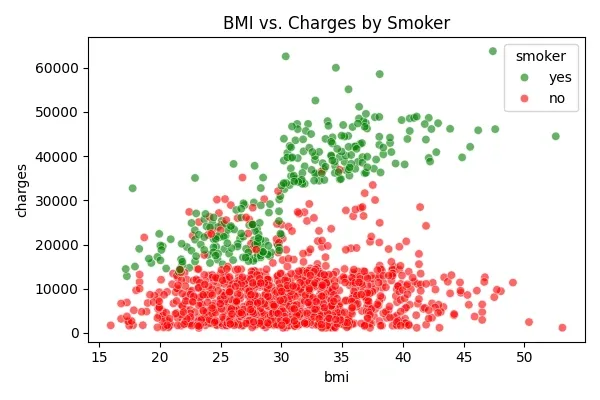
High-BMI smokers face the highest costs, while among non-smokers, the BMI–charges relationship is much weaker.
Correlation Heatmap (Numeric Features)
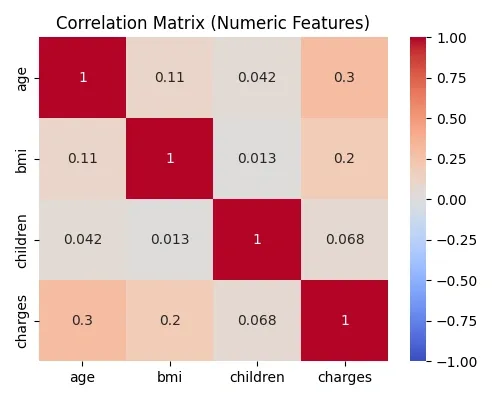
Age and number of children show a moderate positive correlation.
Charges correlate strongly with the smoker flag and moderately with BMI and age.
Pair plot of Numeric Features by Smoker
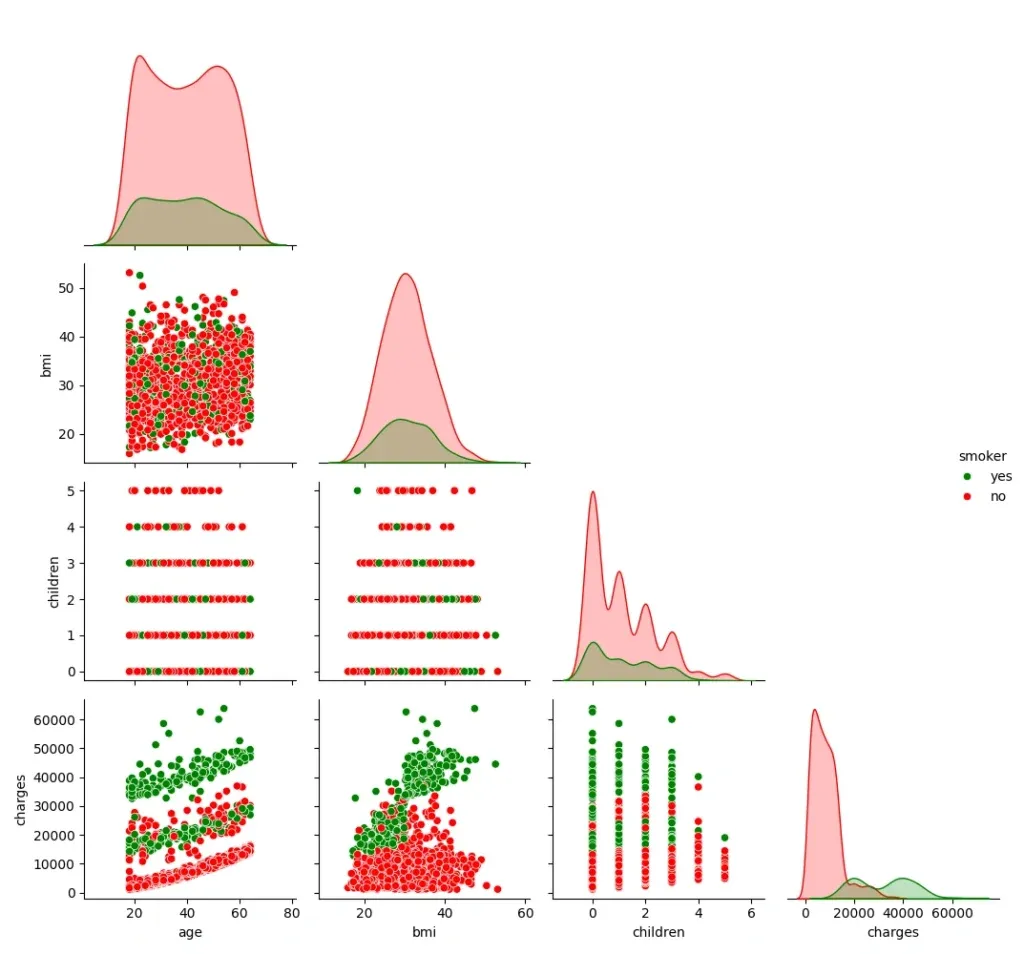
The pairwise panels confirm: smoker status drives most of the spread in charges; age and BMI each show mild joint effects.
Evaluation
Prompt: Give images of classification report and feature importance for the same
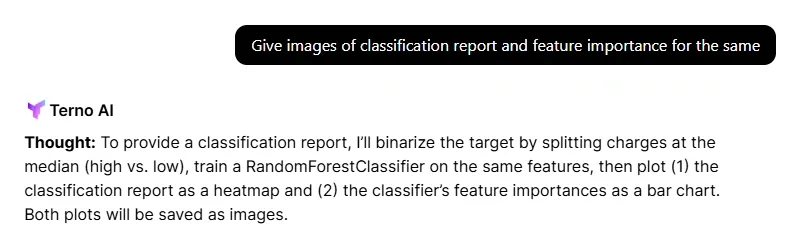
Classification Report
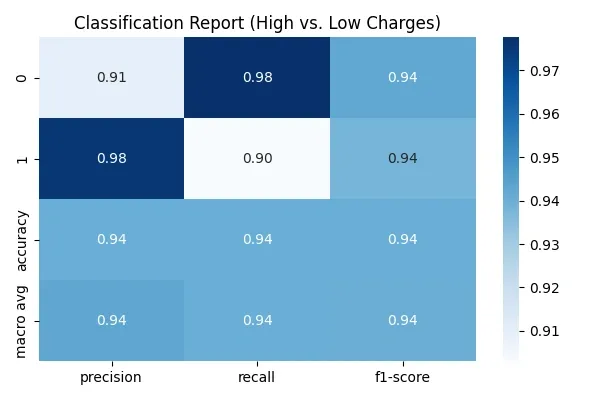
As per the classification report, we can see that the model has a good accuracy of 94%.
The precision and recall are also above 90% for both low & high premiums.
The numbers clearly show that this is a** reliable model** to make predictions on our premium levels.
Feature Importance
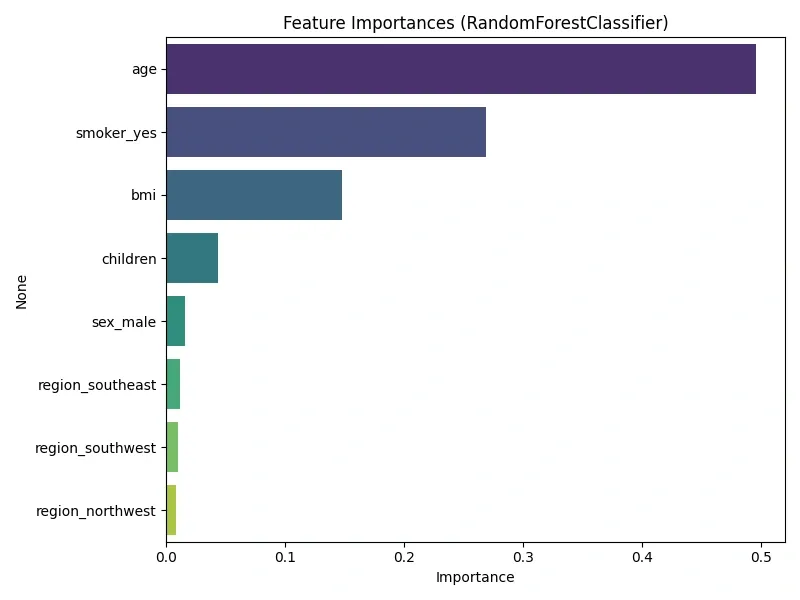
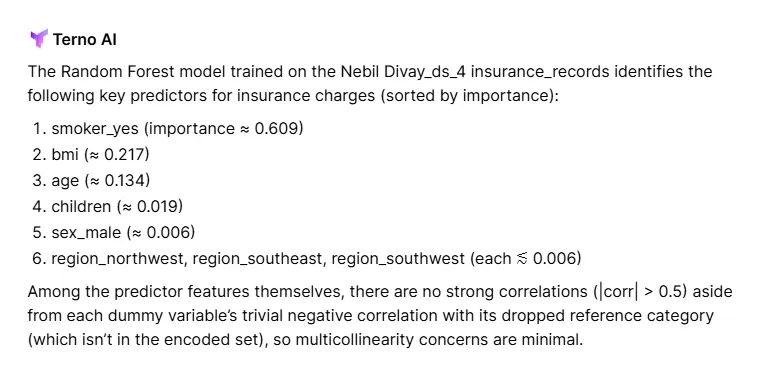
The Random Forest model identifies the following key predictors for insurance charges;
Age
Smoker_yes
BMI
Children
Sex_male
Region_southeast, Region_southwest, Region_northwest
****
From Questions to Answers
Which feature is the strongest reason for the premium?
Smoker status_ is by far the __strongest _driver of cost.
Is BMI a key factor in insurance premiums?
_BMI and age _are secondary predictors with positive relationships to charges.
Btw age and smoking habits, which has a stronger relationship with the premium?
Smoker status is by far the strongest driver of cost. ** **
_ _Does taking insurance early help in reducing the premium amount?
Taking out insurance early can help lower the premium amount
Challenges Identified by Terno AI
Terno AI was not only able to** generate insights** into our problem but also identify some of the challenges with the overall project and provided appropriate suggestions.
- The dataset does not include features like** alcohol consumption, premedical history, existing medical condition,** etc., which also influence insurance premiums.
Recommendations by Terno AI
Terno AI gave us the following recommendations to help us reduce our insurance premium amount. What’s interesting to note here is that these are actually very practical and useful recommendations we can implement in real life. So, the findings can give stakeholders a clear direction to take action.
Taking out insurance early can help lower the premium amount.
Implement robust smoking cessation programs to reduce overall charges.
Focus on weight-management interventions, particularly for current smokers.
Tailor healthcare cost controls in high-charge regions (e.g., the southeast).
Conclusion
We keep saying, AI is the future, but the truth is, it is already here. It is making our work fast, easy, and accurate. **Terno AI** is simply the **best **when it comes to AI Data Scientist models; it helped us complete hours of work in a matter of a few seconds. Please see the full chat link here.
It also helped us uncover hidden insights from data, which would have been very difficult to find otherwise. The recommendations and insights given by Terno AI were both **actionable and practical. **
**So, do you want to do it the old way or the Terno AI** way? The choice is yours !!

18 August 2026
The Honest Number Was 83%: Leakage, Abstention, and a Complaint Router You Can Actually Deploy
The same complaint-routing model scores 96.3% or 83.2% depending on which three columns you leave in the training data. The high number is the intake form being read back to you. This is what the leakage audit found before a single model was trained, why 83.2% is the honest figure, and how the same model — given permission to say "I don't know" — becomes deployable at 90.7% accuracy on 79.5% of traffic.

29 July 2026
EdgeGuard: AI-Driven Predictive Maintenance for Power Transformers
Power transformers are among the most critical assets in electrical distribution infrastructure. Their unexpected failure can result in power outages, safety hazards, equipment damage, expensive repairs, and long service interruptions. Traditional transformer maintenance practices often rely on periodic manual inspection, offline testing, or run-to-failure maintenance. These methods are expensive, slow, labor-intensive, and unable to detect rapidly developing faults in real time. EdgeGuard is an AI-driven, edge-computing predictive maintenance system designed to continuously monitor transformer health and forecast failures before catastrophic damage occurs. The system acts as a retrofittable “Digital Doctor” for distribution transformers by combining low-cost industrial sensors, an ESP32 microcontroller, local intelligence, machine learning-based risk prediction, autonomous relay control, and a real-time web dashboard. The proposed system monitors six major transformer health indicators: temperature, humidity, vibration, oil level, current, and voltage. These signals are normalized and processed through a Multi-Layer Perceptron neural network to classify transformer condition and estimate failure risk. If the predicted risk crosses a critical threshold of 80%, EdgeGuard automatically triggers a relay through GPIO 26 to isolate the transformer from the electrical network. The system also supports secure remote control, dashboard monitoring, API-key-based hardware authentication, JWT-based user access, WebSocket live updates, and automatic live-hardware detection. With an estimated deployment cost of approximately ₹3,850, EdgeGuard offers a low-cost alternative to conventional transformer monitoring systems. Its cloud-independent operation and edge-based decision-making make it especially useful for rural and semi-urban distribution grids where connectivity and maintenance resources are limited.

28 July 2026
ANALYZING TOXIC USER BEHAVIOR AND RISK PATTERNS IN ONLINE GAMING PLATFORMS
This study shows that behavioral data alone can't reliably predict gaming toxicity — but a risk-based model combining behavioral and engineered features does a much better job of flagging the small segment of high-risk users driving disproportionate harm.