
Data Driven Staffing and Service Level Analysis
The Business Process Outsourcing (BPO) industry involves contracting specific business functions to third-party service providers. It encompasses a wide range of services such as customer support, human resources, finance, and IT operations. BPO has become a strategic tool for companies seeking to optimize costs, improve efficiency, and focus on core business activities.
In today’s hyper-competitive business world, customer experience is everything. A single delayed response or a long waiting time can be the difference between a satisfied customer and one who never returns. Call centers sit at the heart of this customer experience, handling thousands of interactions daily.
Introduction
Managing a high-volume call center requires balancing service quality against operational costs. Too few agents lead to long wait times and lost customers; too many waste payroll budget.
Explore call‐volume, abandonment, waiting‐time, and service‐level trends
Build an Erlang C–based staffing model to compute the daily required agents
Identify peak and lean days
Classify days as “good” vs. “bad” based on service‐level thresholds
Forecast the next month’s staffing needs with an ARIMA model
All code, data tables, and interactive visualizations are linked below, and they are taken from terno.ai responses.
What we can learn/predict from this dataset:
Let's explore some use cases using terno AI to predict and learn the following things from the dataset
Descriptive insights (analytics)
Predictive modeling
Operational improvements
**Use cases for this dataset **
Explore the dataset and create visualizations for table
Find the correlated tables from the dataset
Explore descriptive insight analysis, such as the average number of calls and peak call time.
Predictive modeling for staffing and SLA
Operational improvements like identifying bottlenecks and optimal staffing
Dataset Overview
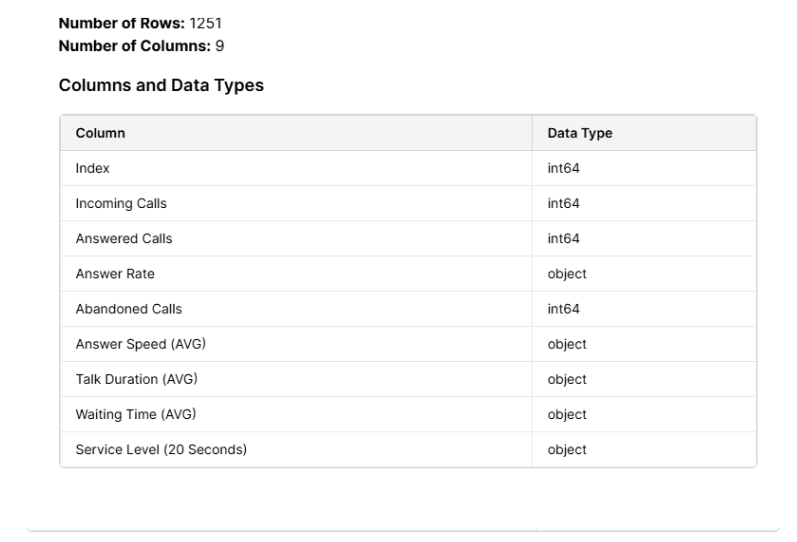
The dataset contains 1,251 records of call center performance metrics. It captures both operational workload (e.g., incoming and answered calls) and service quality indicators (e.g., answer rate, average waiting time, and service level). Each row represents call center activity for a specific time period (likely daily).
Key Features:
Incoming Calls & Answered Calls → Measures call volume and responsiveness.
Answer Rate & Abandoned Calls → Show customer experience and call center efficiency.
Answer Speed (AVG) → How quickly calls are picked up.
Talk Duration (AVG) → Typical length of conversations.
Waiting Time (AVG) → How long customers wait before being served.
Service Level (20 Seconds) → % of calls answered within 20s (a standard KPI in call centers).
You can download the raw CSV here: Call Center Data.csv
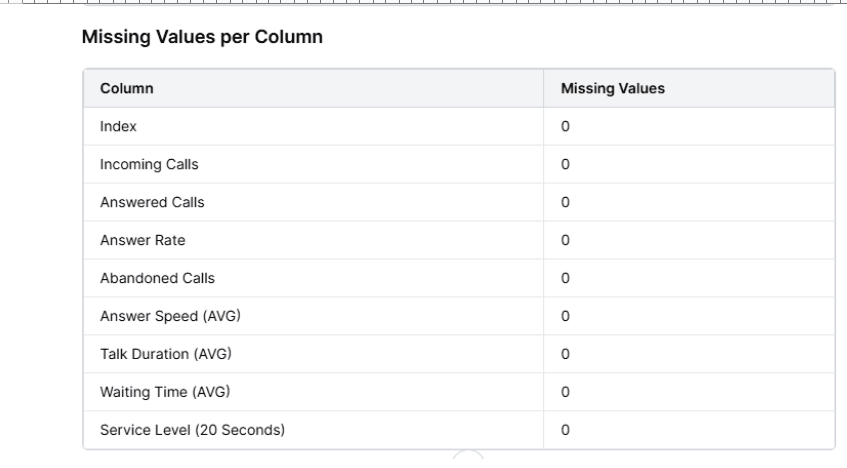
Lets have a look at dataset columns and its types and missing values as provided by the terno.ai after dataset analysis.
** Key Descriptive Insights**
Call Volume
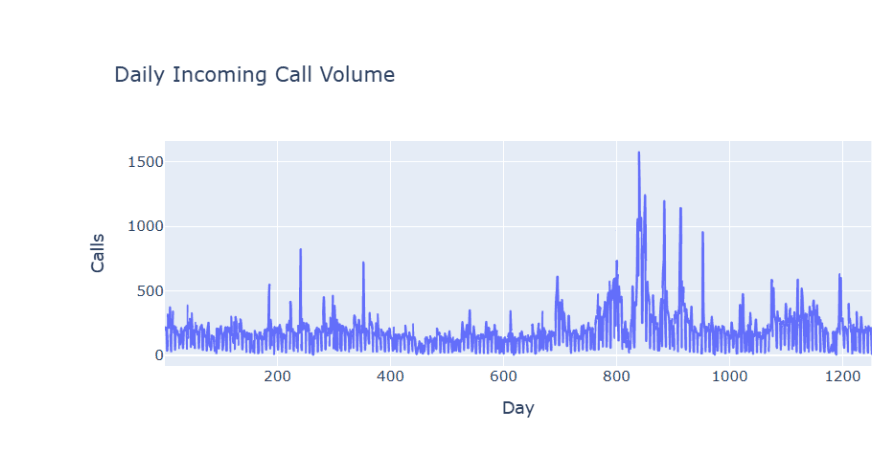
On average, the call center received ~199 calls per day, with peaks of up to 1,575 calls.
Answered calls averaged ~177 per day, showing strong capacity.
Service Quality
The answer rate averaged 92.7%, with a best case of 100%.
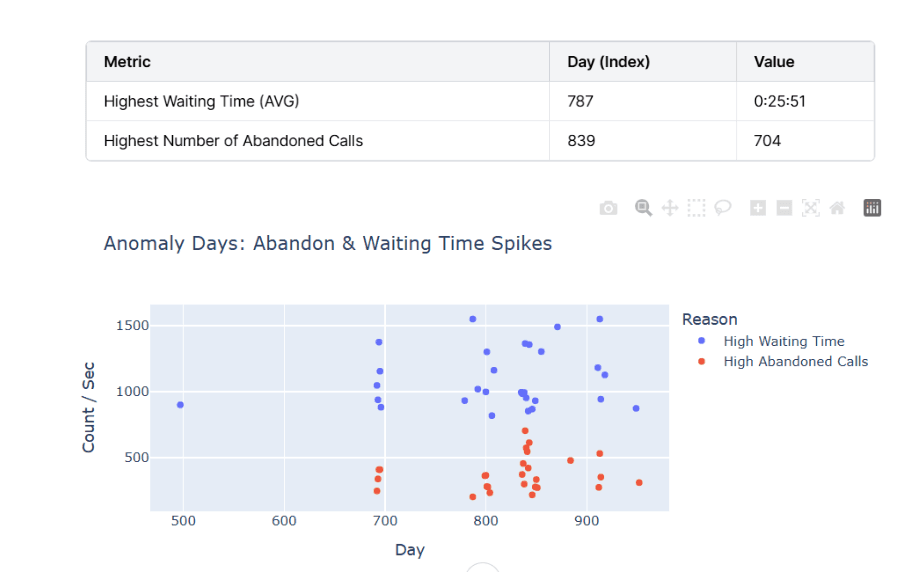
Abandoned calls averaged 21 per day, but extreme cases saw up to 704 abandoned calls—a red flag.
Customer Wait Experience
Average answer speed: 24 seconds (best: 2 seconds, worst: 5 minutes).
Average waiting time: around 25 seconds, but in some cases stretched to minutes—likely resulting in higher abandonment rates.
Service Level KPI
The “20-second service level” averaged above 75%, which is good but still leaves room for improvement.
Use Cases & Business Goals
Terno link for use cases:- Terno Use cases
Lets take a look at the different use cases that can help the business in reporting and predictive analysis using Terno AI. Below are the responses and insights provided by the Terno AI for the following use cases
- Operational Monitoring & Reporting
- Track daily call volumes to understand staffing needs. :- It's very important to track the daily incoming calls in the BPO industry. We are tracking daily incoming calls over time.
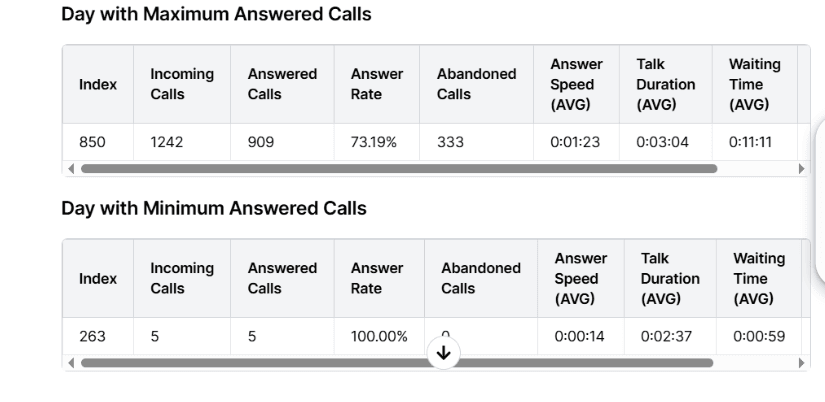
- **Monitor answer rates and service levels to ensure performance KPIs are met **– one of the most important KPI of BPO industry is answered calls and meeting SLA. 850 days have 73% answering call rate, and 263 days have recorded the lowest call rate.
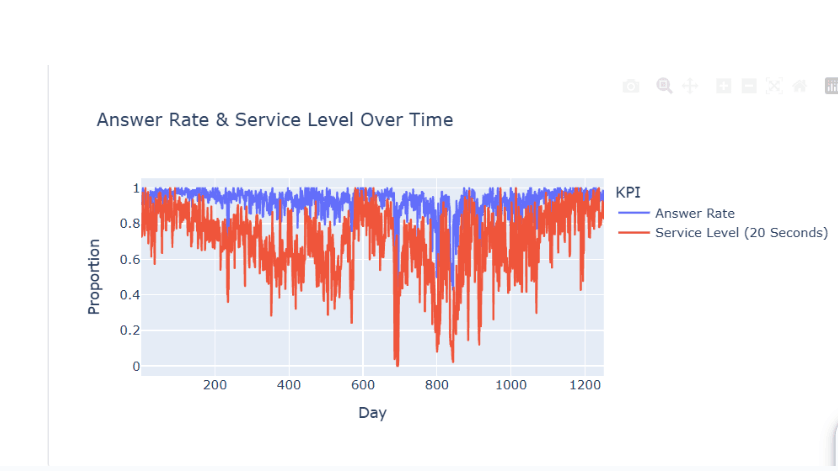
- Identify anomalies like sudden spikes in abandon rates or waiting times. Let's check which days we have the highest abandonment rate and waiting times
**2. Customer Experience Analysis **
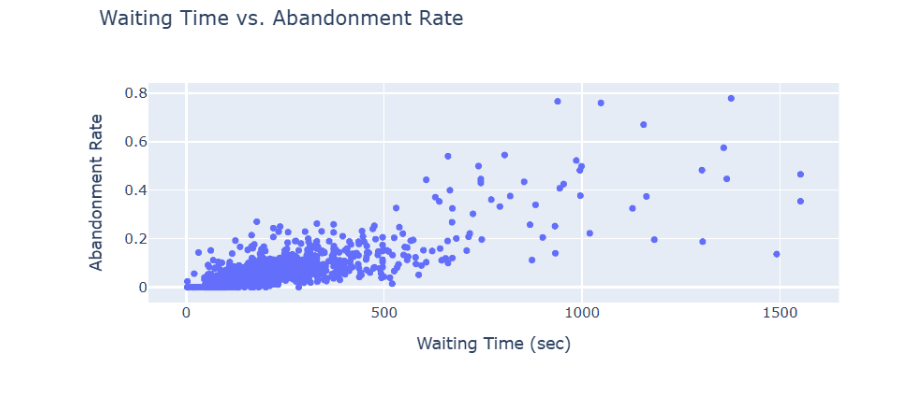
If the average waiting time is short (e.g., 15–30 seconds), abandonment is usually very low (just a few calls).
But when waiting times stretch to minutes (e.g., 2–5 minutes), abandonment can spike dramatically — in the dataset, we saw up to 704 abandoned calls in a single period.
👉 This shows that long queues directly drive customer frustration.
** Answer Speed vs Service Level**
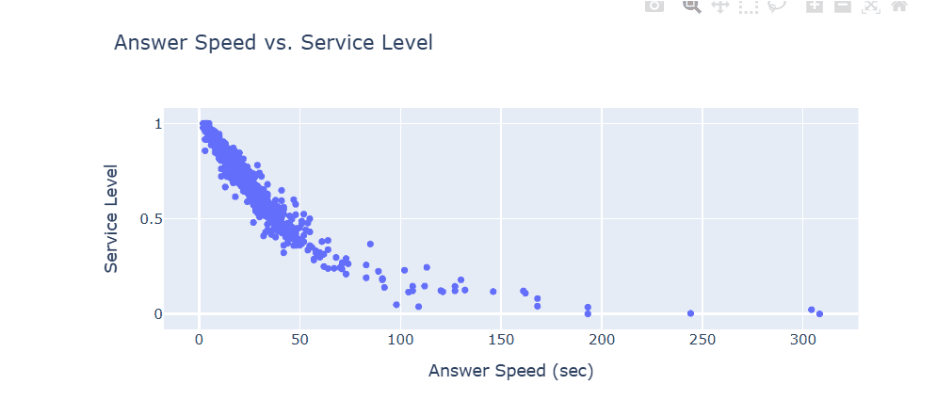
When agents answer within 20 seconds, the service level metric is consistently above 80–90%.
However, if the average answer speed increases (say above 60 seconds), the service level drops sharply.
👉 Quick responses improve not just customer satisfaction, but also the KPI compliance for service levels.
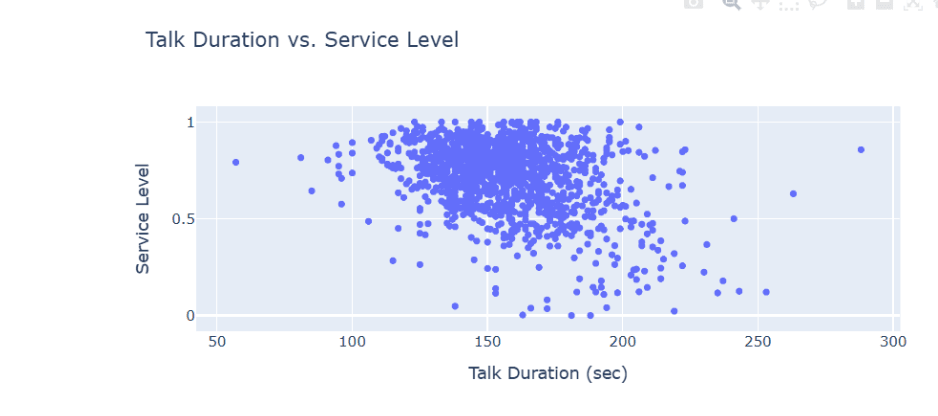
Talk Duration vs Resolution Quality
The dataset shows an average talk duration of ~2 minutes 30 seconds.
When talk duration is too short (e.g., under 1 minute), the answer rate can still be high, but it might indicate rushed calls without solving problems.
When talk duration is consistent around 2–3 minutes, answer rates remain strong while balancing customer interaction quality.
This balance suggests that agents should not just answer quickly but also spend enough time on resolution.
- Predictive Analytics
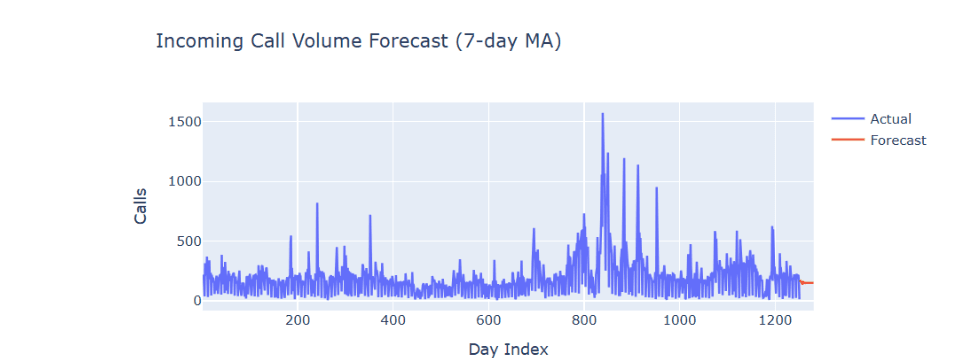
- **Call Volume Forecasting: **Predict daily incoming calls using time series to optimize staffing. It is important to do the staffing model for the coming months
- Abandonment Prediction → Classify if a call will be abandoned based on wait time, answer speed, and workload.
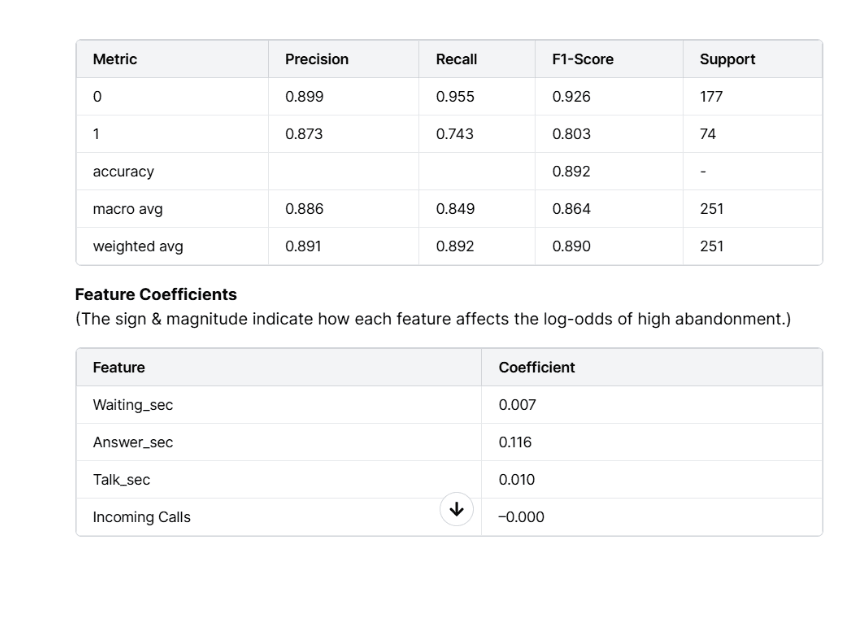
- Service Level Classification → Predict whether service level will stay above the 80% target in real time.
- Operational Efficiency
- **Compare agent availability vs customer demand to optimize schedules. **
Terno shows the detailed analysis of customer demand and availability of agent, it increases the overall efficiency by managing and predicting number of agents per call.
Improve Customer Satisfaction → Faster response times and reduced abandoned calls lead to happier customers.
Optimize Workforce Planning → Predict call peaks to schedule the right number of agents at the right time.
Reduce Costs → Eliminate inefficiencies by forecasting call demand and allocating resources effectively.
Increase KPI Compliance → Consistently achieve targets such as Answer Rate > 95% and Service Level > 80%.
** Conclusion**
This dataset provides a rich lens into call center operations, bridging the gap between raw metrics and customer experience improvements. By analyzing it, organizations can transform customer service from a reactive cost center into a proactive driver of loyalty and efficiency.
In the age of data-driven business, call centers that leverage predictive insights will not only reduce wait times and abandonment but also deliver exceptional customer journeys.

18 August 2026
The Honest Number Was 83%: Leakage, Abstention, and a Complaint Router You Can Actually Deploy
The same complaint-routing model scores 96.3% or 83.2% depending on which three columns you leave in the training data. The high number is the intake form being read back to you. This is what the leakage audit found before a single model was trained, why 83.2% is the honest figure, and how the same model — given permission to say "I don't know" — becomes deployable at 90.7% accuracy on 79.5% of traffic.

29 July 2026
EdgeGuard: AI-Driven Predictive Maintenance for Power Transformers
Power transformers are among the most critical assets in electrical distribution infrastructure. Their unexpected failure can result in power outages, safety hazards, equipment damage, expensive repairs, and long service interruptions. Traditional transformer maintenance practices often rely on periodic manual inspection, offline testing, or run-to-failure maintenance. These methods are expensive, slow, labor-intensive, and unable to detect rapidly developing faults in real time. EdgeGuard is an AI-driven, edge-computing predictive maintenance system designed to continuously monitor transformer health and forecast failures before catastrophic damage occurs. The system acts as a retrofittable “Digital Doctor” for distribution transformers by combining low-cost industrial sensors, an ESP32 microcontroller, local intelligence, machine learning-based risk prediction, autonomous relay control, and a real-time web dashboard. The proposed system monitors six major transformer health indicators: temperature, humidity, vibration, oil level, current, and voltage. These signals are normalized and processed through a Multi-Layer Perceptron neural network to classify transformer condition and estimate failure risk. If the predicted risk crosses a critical threshold of 80%, EdgeGuard automatically triggers a relay through GPIO 26 to isolate the transformer from the electrical network. The system also supports secure remote control, dashboard monitoring, API-key-based hardware authentication, JWT-based user access, WebSocket live updates, and automatic live-hardware detection. With an estimated deployment cost of approximately ₹3,850, EdgeGuard offers a low-cost alternative to conventional transformer monitoring systems. Its cloud-independent operation and edge-based decision-making make it especially useful for rural and semi-urban distribution grids where connectivity and maintenance resources are limited.

28 July 2026
ANALYZING TOXIC USER BEHAVIOR AND RISK PATTERNS IN ONLINE GAMING PLATFORMS
This study shows that behavioral data alone can't reliably predict gaming toxicity — but a risk-based model combining behavioral and engineered features does a much better job of flagging the small segment of high-risk users driving disproportionate harm.