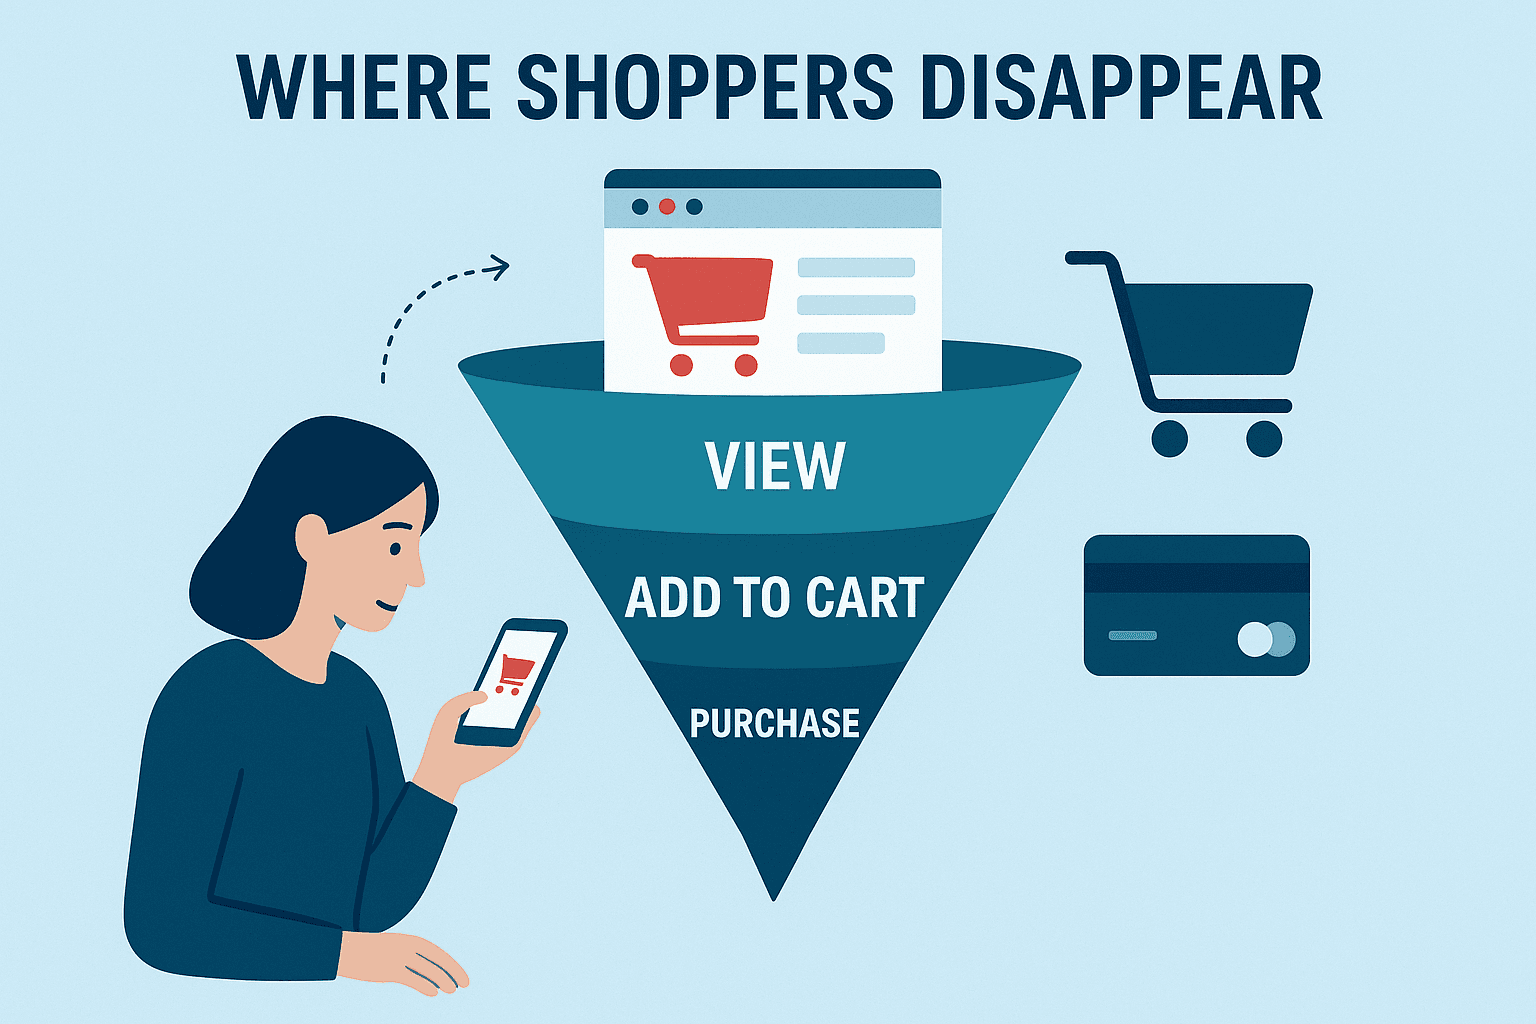
Introduction: Understanding the Digital Shopper
Every e-commerce business thrives on one core journey: users view a product, add it to their cart, and—ideally—complete the purchase. But somewhere along that path, a significant portion of shoppers fall off.
My goal was simple:
Identify where shoppers drop off and why.
Instead of writing SQL or stitching together dashboards, I used TernoAI, a no-code analytical assistant that understands natural-language commands. Throughout this analysis, I asked TernoAI a series of prompts, and it returned complete, accurate insights within seconds.
Step 1: Reconstructing the Funnel
To begin, I asked:
Prompt:
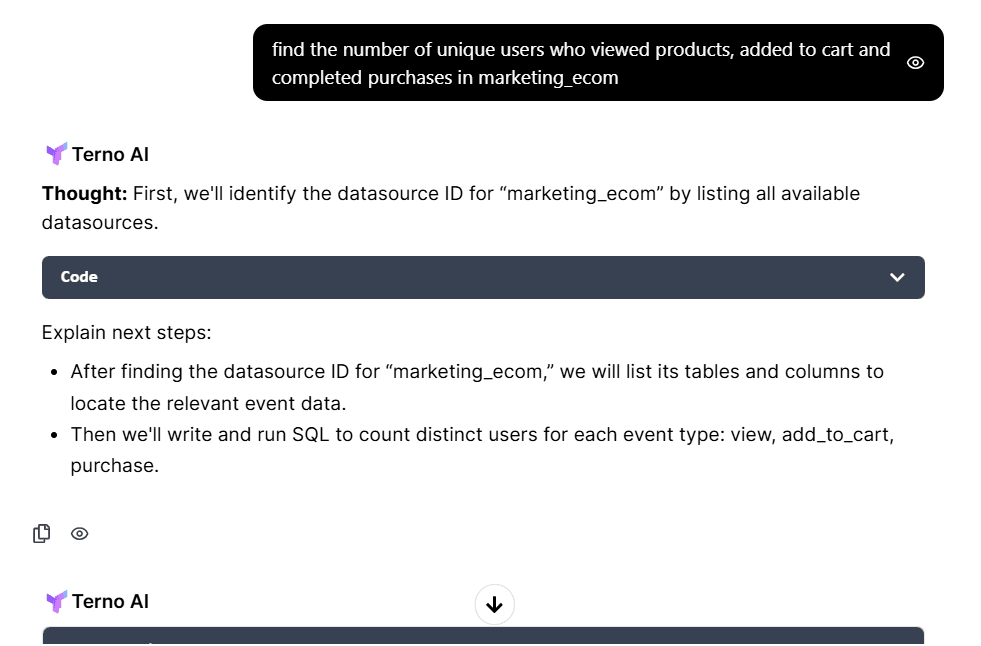
“Find the number of unique users who viewed products, added to cart, and completed purchases in marketing_ecom.”
TernoAI scanned the datasource and returned the key funnel stages:
| Funnel Stage | Unique Users |
|---|---|
| Viewed Product | 79,995 |
| Added to Cart | 79,995 |
| Purchased | 27,380 |
Immediately, two insights became clear:
1. Interest is strong.
Every user who viewed a product also added it to their cart—an extremely positive sign for product discovery and catalog quality.
2. Checkout is the problem.
Despite perfect engagement up to the cart, only one-third completed their purchase.
This is the main break point in the funnel.
Step 2: Measuring Conversion at Each Stage
To quantify exactly how effectively users move from one stage to another, I prompted:
Prompt:
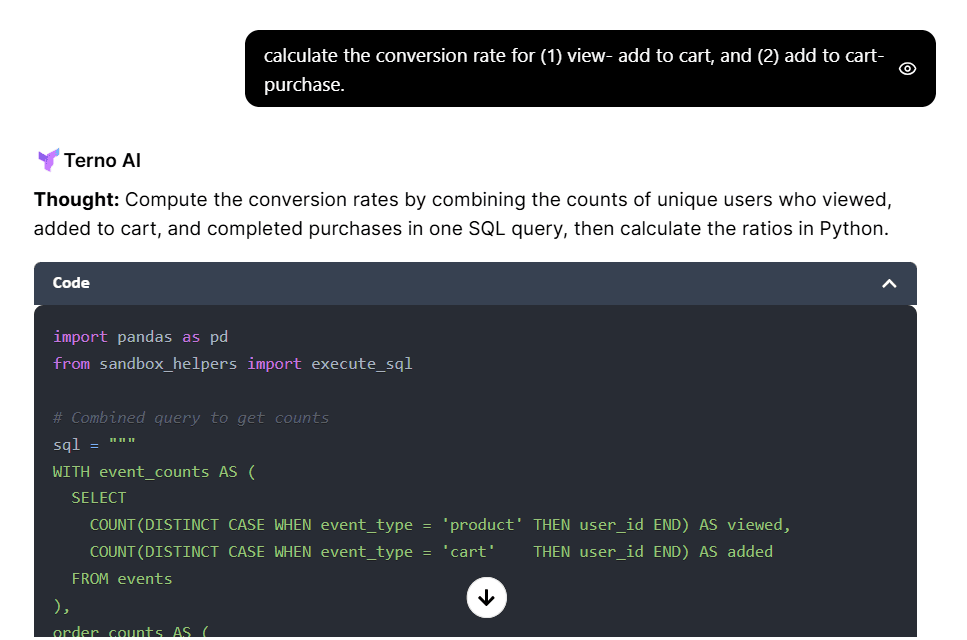
“Calculate the conversion rate for (1) view–add to cart, and (2) add to cart–purchase.”
The results were:
| Step | Conversion Rate |
|---|---|
| View → Add to Cart | 100% |
| Add to Cart → Purchase | 34.23% |
This clearly shows that while product pages are performing exceptionally well, the checkout process is losing 66% of users.
From a business perspective, this is where optimization efforts will have the highest revenue impact.
Step 3: Which Age Groups Convert the Best?
To understand user behavior more deeply, I asked:
Prompt:
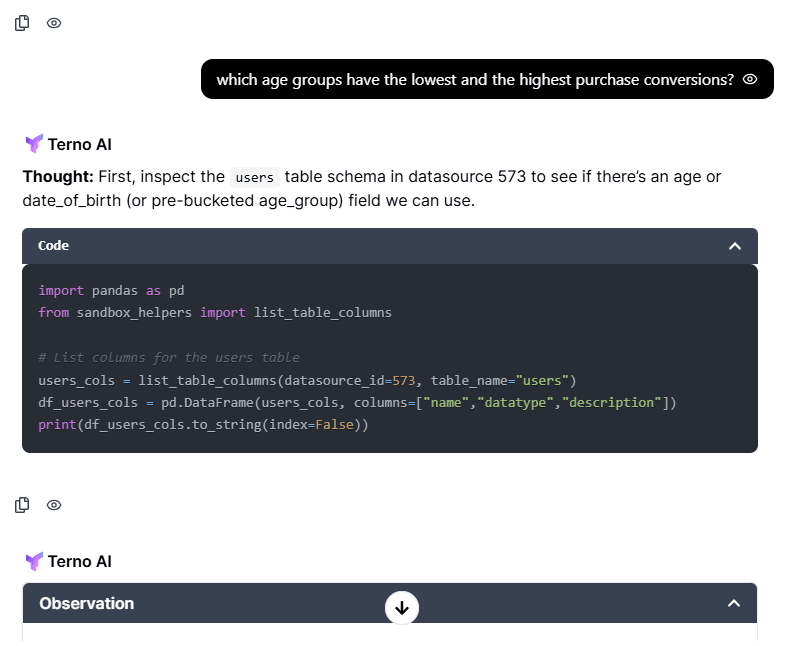
“Which age groups have the lowest and highest purchase conversions?”
TernoAI segmented users by age and analyzed their purchase behavior:
| Age Group | Conversion Rate |
|---|---|
| 18-24 | 33.59% |
| 45-54 | 34.98% |
While the difference may appear small, it reflects meaningful behavioral patterns:
Younger shoppers (18–24) explore more but hesitate during checkout—typically due to price sensitivity or lower trust.
Older shoppers (45–54) convert more consistently—suggesting clearer intent and stronger buying confidence.
This insight guides more personalized marketing strategies.
Step 4: Category-Level Performance — Where Do Users Drop Off Most?
Next, I wanted to identify whether certain product categories drive more drop-off than others.
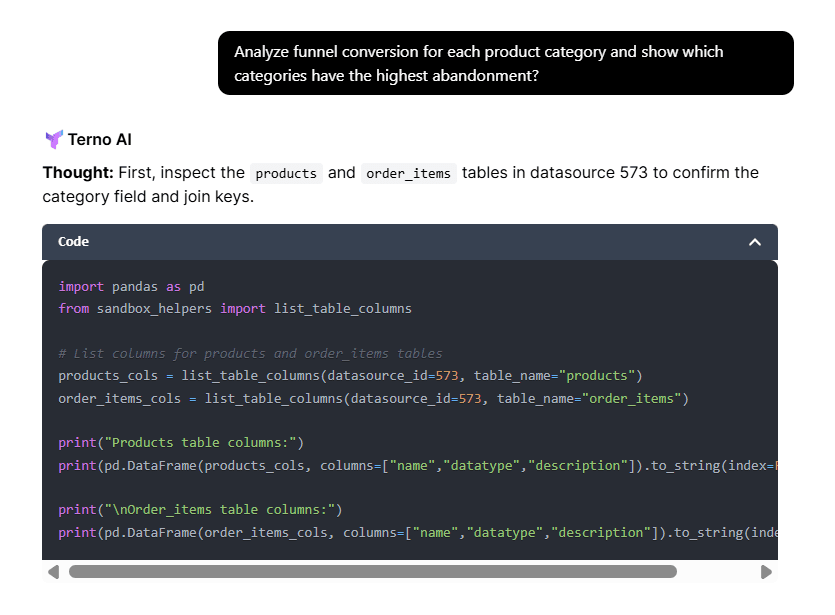
Prompt:
“Analyze funnel conversion for each product category and show which categories have the highest abandonment.”
Since add-to-cart events didn’t include product IDs, TernoAI analyzed view-to-purchase conversions instead.
Categories with the Highest Abandonment (~76%)
Blazers & Jackets
Clothing Sets
These categories tend to involve sizing uncertainty, higher pricing, or style risk, all common drivers of hesitation.
Categories with the Lowest Abandonment (~72%)
Underwear
Suits & Sport Coats
These items generally offer more predictable sizing, making users more confident in purchasing.
This insight is crucial for category managers, UX teams, and merchandising strategy.
Step 5: Visualizing the Funnel
To visualize the user flow, I requested:
Prompt:
“Create a funnel chart showing number of users who viewed, added to cart, and purchased.”
TernoAI generated a clean funnel chart that made the sharp drop at the purchase stage visually unmistakable—perfect for presentations or stakeholder reports.
Step 6: Turning Insights Into Action
With the funnel mapped and drop-off points identified, I asked TernoAI:
Prompt:
“Give marketing recommendations to reduce funnel drop-off and improve conversions.”
Here are the key strategies supported by the data:
1. Optimize Checkout (Top Priority)
This is the largest source of revenue loss.
Enable guest checkout
Offer fast payment methods (UPI, Paytm, Apple/Google Pay)
Display shipping fees earlier
Add trust badges (“Secure Checkout”, “Free Returns”)
Reduce checkout steps
Send abandoned-cart reminders
Even incremental improvements here can lift conversions meaningfully.
2. Strengthen Confidence in High-Abandonment Categories
Especially Blazers, Jackets, and Clothing Sets.
Enhanced size and fit guidance
More photos of models with height/fit details
Real customer reviews with images
Clear, flexible return policies
Fit-prediction tools
Reducing uncertainty leads to higher conversions.
3. Tailor Messaging by Age Segment
For 18–24 (low conversion):
Student discounts
Buy Now Pay Later (BNPL)
Influencer-led content
Prominent return guarantees
For 45–54 (high-intent):
Premium bundles
Loyalty program rewards
Personalized recommendations
Segmentation ensures marketing feels relevant rather than generic.
4. A/B Test Key Touchpoints
A/B testing helps identify which changes truly improve conversions.
Test:
• Different checkout button text (e.g., “Complete Order” vs. “Secure Checkout”)
• Placement of trust badges, return policies, or shipping info
• One-page vs. multi-step checkout layouts
• Visibility of discounts, promo codes, or free-shipping banners
• Tone and timing of abandoned-cart reminders
Even small winning variations can create measurable lifts in conversion rates.
Conclusion: The Funnel Is a Conversation, Not Just a Metric
This analysis demonstrated how much you can uncover with the right questions.
Using TernoAI, I was able to:
Map the customer journey end-to-end
Identify the exact point of drop-off.
Compare behavior across age groups.
Understand category-level friction
Generate actionable, revenue-focused strategies.
All without writing a single line of code.
Beneath every number is a shopper making a decision.
And when we understand those decisions
We can build better, more confident buying experiences.

18 August 2026
The Honest Number Was 83%: Leakage, Abstention, and a Complaint Router You Can Actually Deploy
The same complaint-routing model scores 96.3% or 83.2% depending on which three columns you leave in the training data. The high number is the intake form being read back to you. This is what the leakage audit found before a single model was trained, why 83.2% is the honest figure, and how the same model — given permission to say "I don't know" — becomes deployable at 90.7% accuracy on 79.5% of traffic.

29 July 2026
EdgeGuard: AI-Driven Predictive Maintenance for Power Transformers
Power transformers are among the most critical assets in electrical distribution infrastructure. Their unexpected failure can result in power outages, safety hazards, equipment damage, expensive repairs, and long service interruptions. Traditional transformer maintenance practices often rely on periodic manual inspection, offline testing, or run-to-failure maintenance. These methods are expensive, slow, labor-intensive, and unable to detect rapidly developing faults in real time. EdgeGuard is an AI-driven, edge-computing predictive maintenance system designed to continuously monitor transformer health and forecast failures before catastrophic damage occurs. The system acts as a retrofittable “Digital Doctor” for distribution transformers by combining low-cost industrial sensors, an ESP32 microcontroller, local intelligence, machine learning-based risk prediction, autonomous relay control, and a real-time web dashboard. The proposed system monitors six major transformer health indicators: temperature, humidity, vibration, oil level, current, and voltage. These signals are normalized and processed through a Multi-Layer Perceptron neural network to classify transformer condition and estimate failure risk. If the predicted risk crosses a critical threshold of 80%, EdgeGuard automatically triggers a relay through GPIO 26 to isolate the transformer from the electrical network. The system also supports secure remote control, dashboard monitoring, API-key-based hardware authentication, JWT-based user access, WebSocket live updates, and automatic live-hardware detection. With an estimated deployment cost of approximately ₹3,850, EdgeGuard offers a low-cost alternative to conventional transformer monitoring systems. Its cloud-independent operation and edge-based decision-making make it especially useful for rural and semi-urban distribution grids where connectivity and maintenance resources are limited.

28 July 2026
ANALYZING TOXIC USER BEHAVIOR AND RISK PATTERNS IN ONLINE GAMING PLATFORMS
This study shows that behavioral data alone can't reliably predict gaming toxicity — but a risk-based model combining behavioral and engineered features does a much better job of flagging the small segment of high-risk users driving disproportionate harm.